Tired of not knowing what your content marketing efforts are resulting in?
Then you need to learn how to measure content marketing success through KPIs.
Key performance indicators are important metrics marketers can follow to analyze progress and optimize strategies along the way.
Tons of entrepreneurs run blogs or other content hubs—which is great—but few measure them.
That’s why I wanted to write this article today and help people like you understand crucial KPIs to improve your content marketing strategy.
While these KPIs are mostly focused on blogs or similar material, they can be applied to just about any form of content.
Let’s get into it!
Content marketing KPIs
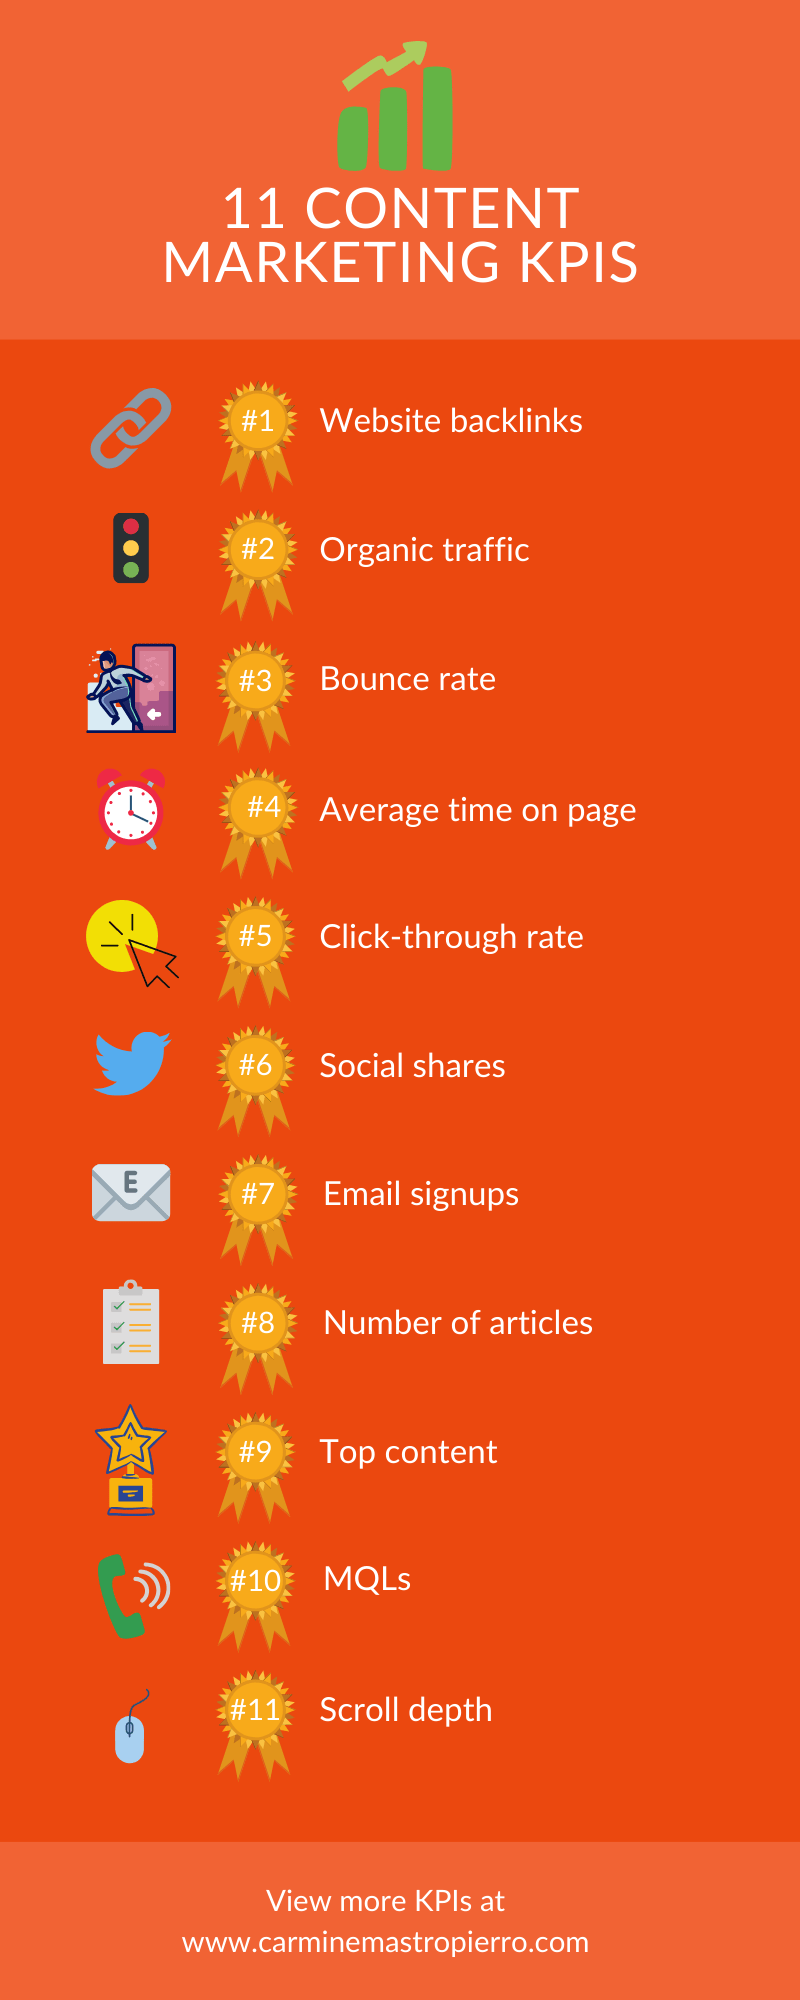
Below are KPIs that your company needs to track to determine the performance and return of content.
1. Backlinks pointing to your website
It’s no secret that backlinks are important.
They act as a voting system, telling search engines which websites and pieces of content are popular and important.
Backlink-building campaigns are often a large component of a content strategy, so it’s an ideal marketing KPI to track.
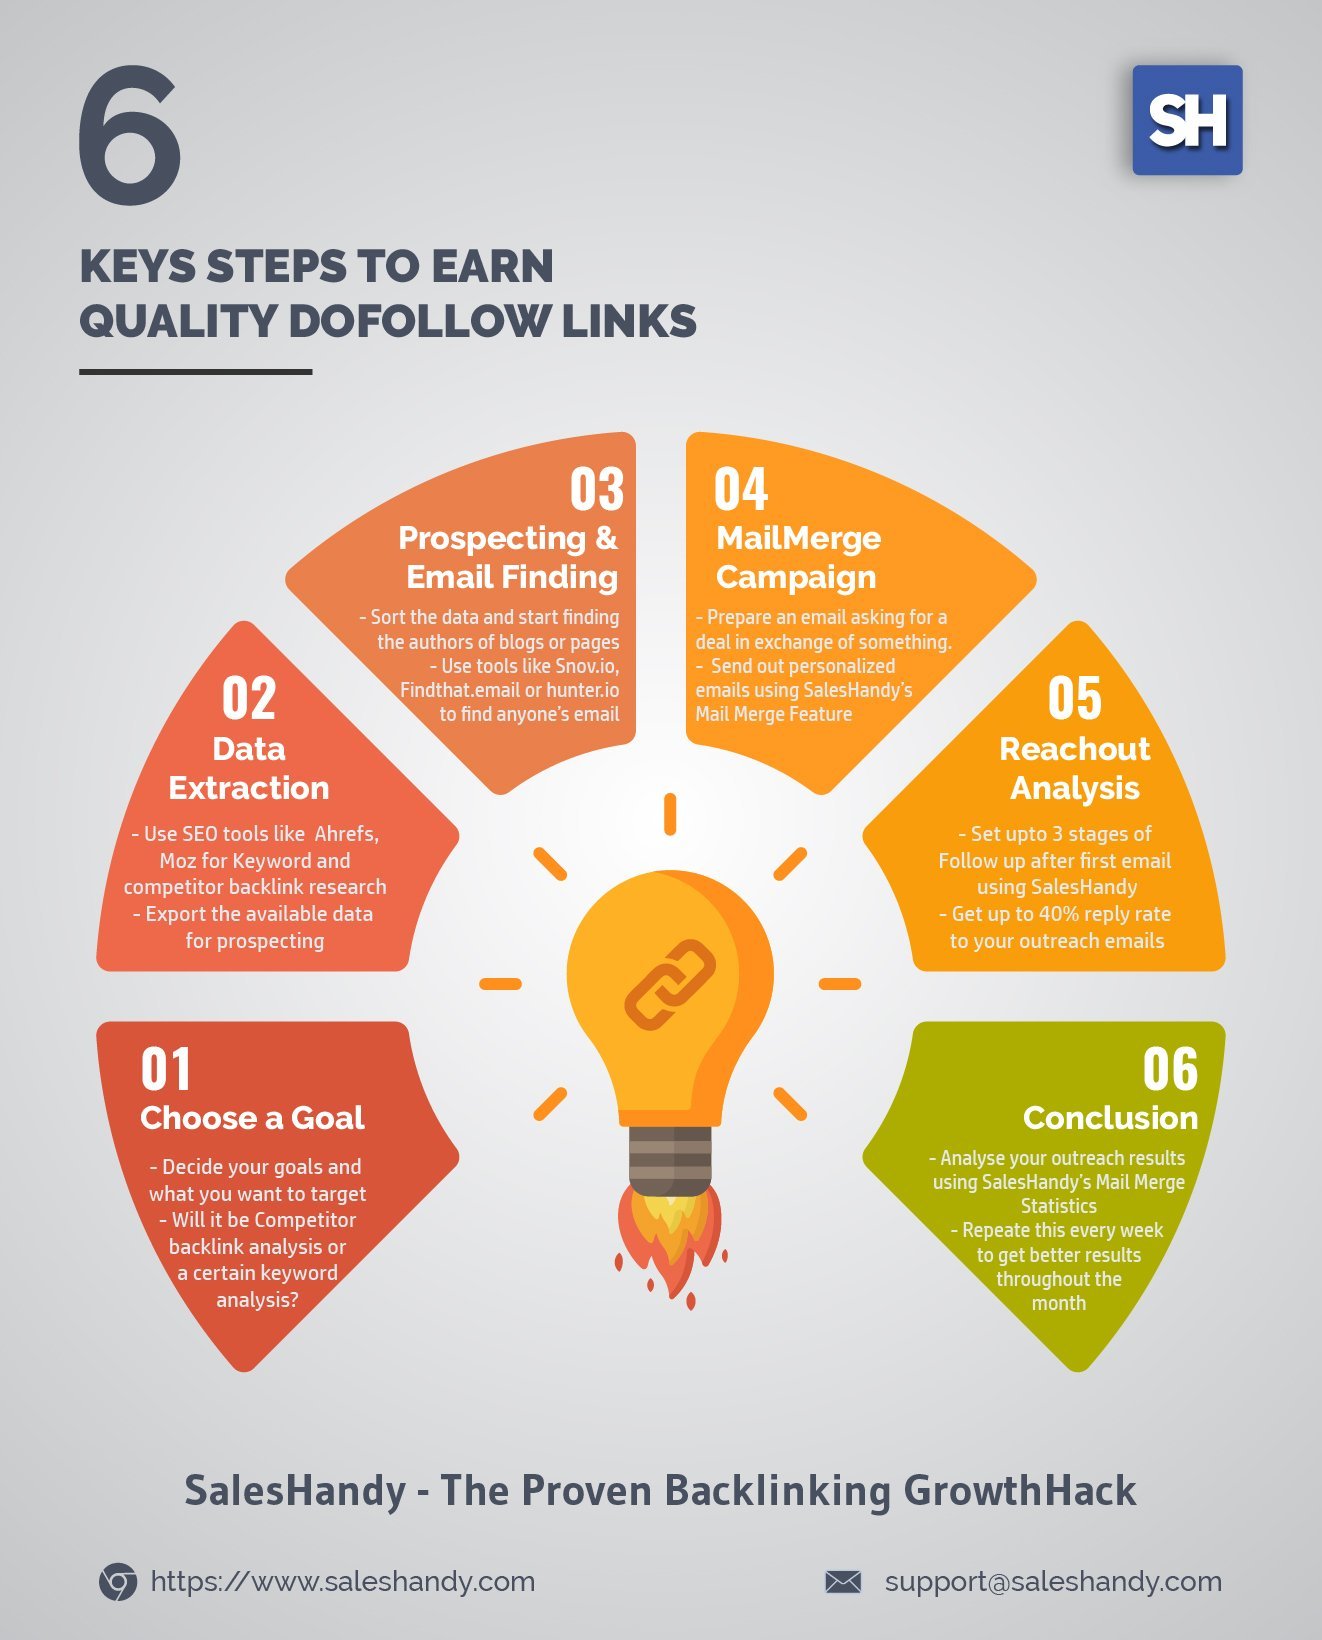
SalesHandy lays out the steps to building high-quality do-follow links perfectly.
It begins with choosing a goal, such as analyzing competitors, deciding on a specific link-building method, and what KPIs to set.
The second step is to use SEO tools to find where your competitors are earning links from and to research keywords.
Since outreach is involved in many of the main link-building methods out there, SalesHandy states the third step is to begin prospecting. Tools like Hunter.io and HubSpot are priceless at this stage.
Personalize emails, and ensure that you don’t use a copy-and-paste template. Split test subject lines, email bodies, and other components to increase conversion rates over time, as well.
Once you get a campaign rolling, it’s time to measure it! I recommend using software like SEMrush since it has a free version and features a great backlink profile analysis.
Sign up from here, and enter a URL into the top search bar once you’re signed in.
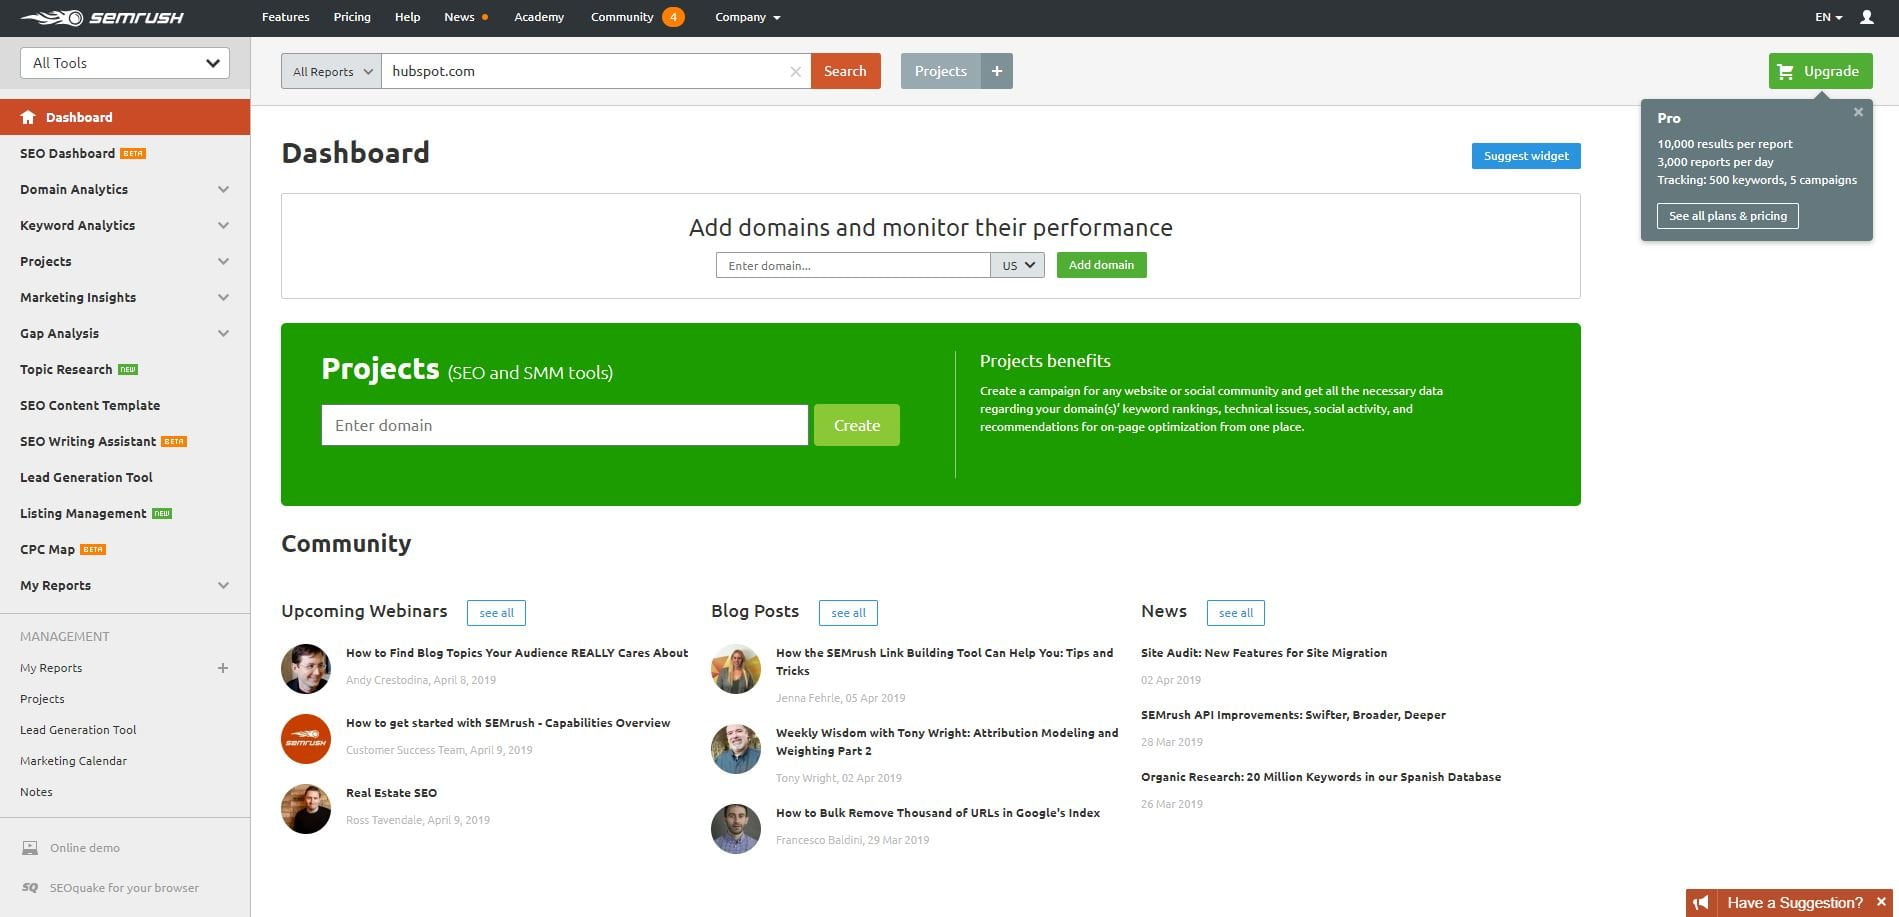
Click the orange “Search” button, and it will take you to the domain overview page.
Click the backlinks button to see a breakdown of your links, anchor text, source URL, and other information.
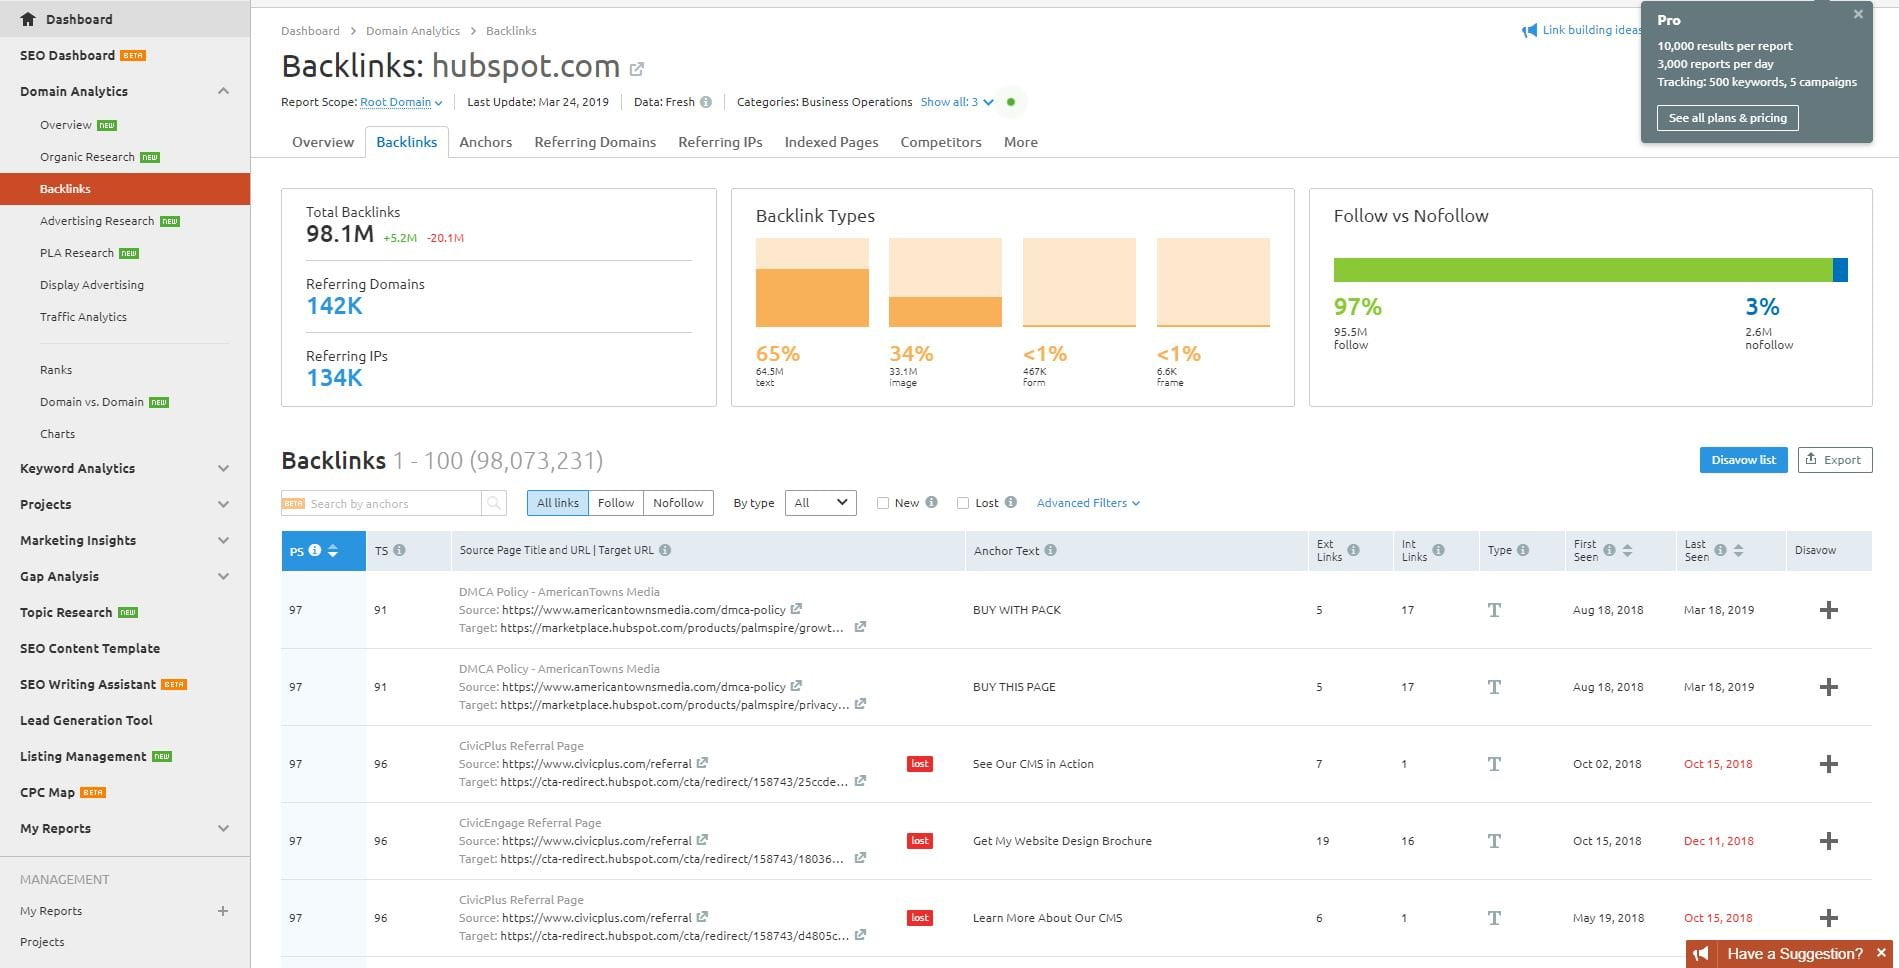
Check this content strategy KPI on a regular basis whether or not you perform backlink-building campaigns.
If you build high-quality content in general, people will naturally link to it over time as a resource for their readers.
2. Organic traffic
Have you ever felt the thrill of opening Google Analytics and seeing your traffic soar to new heights?
It’s exhilarating!
Users, visitors, and page views are also crucial blogging KPIs. Not just fun things to look at.
Whether you’re driving traffic to a blog, YouTube channel, or other platform, you need to be paying attention to how it’s changing over time.
This is why I highly suggest you connect your web property to Google Analytics.
You can do so by signing up, and creating a new property via the admin panel.
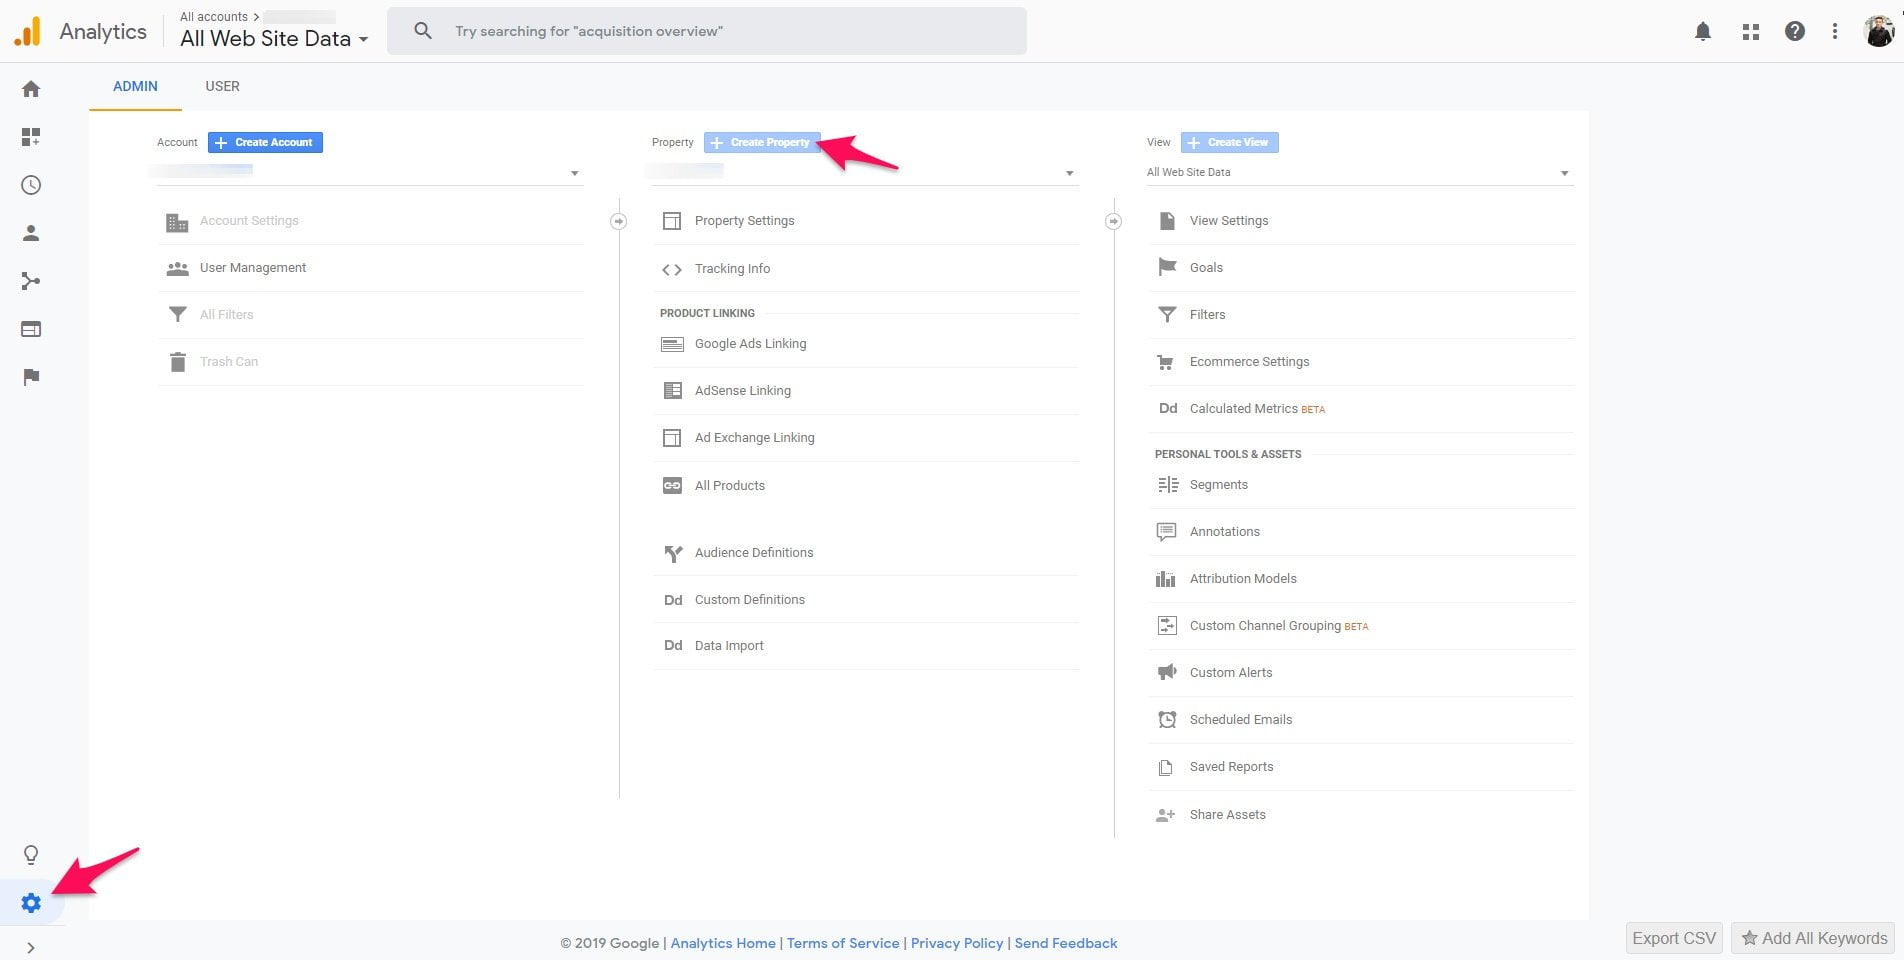
This will give you an authorization code you will then need to input into an app or plugin, depending on which platform you use.
I’m on WordPress, for example. That means I use the free MonsterInsights plugin that connects to my GA account with as little effort as possible.
Once your account begins collecting data, you can view user count on the main dashboard, as it’s displayed by default.
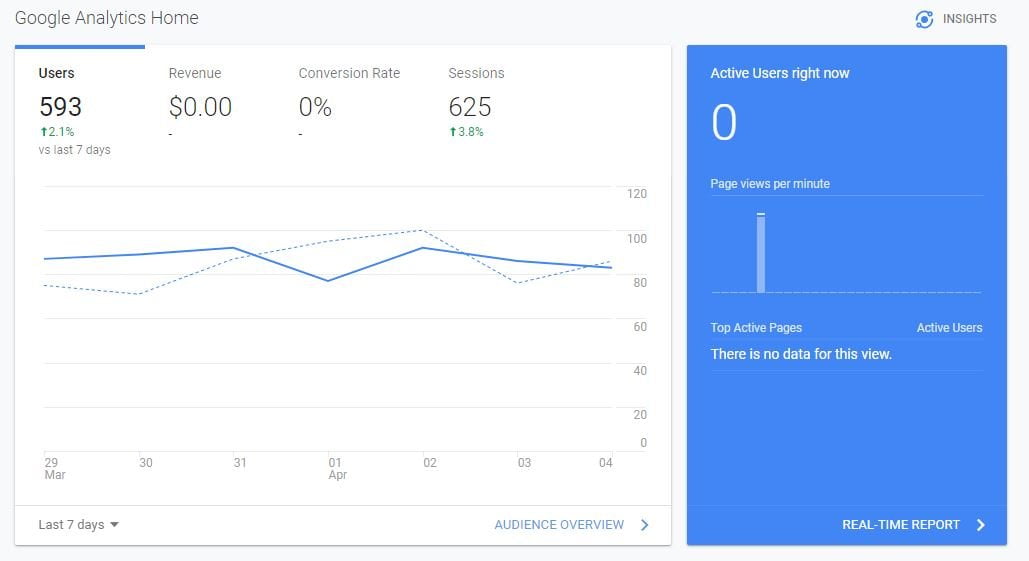
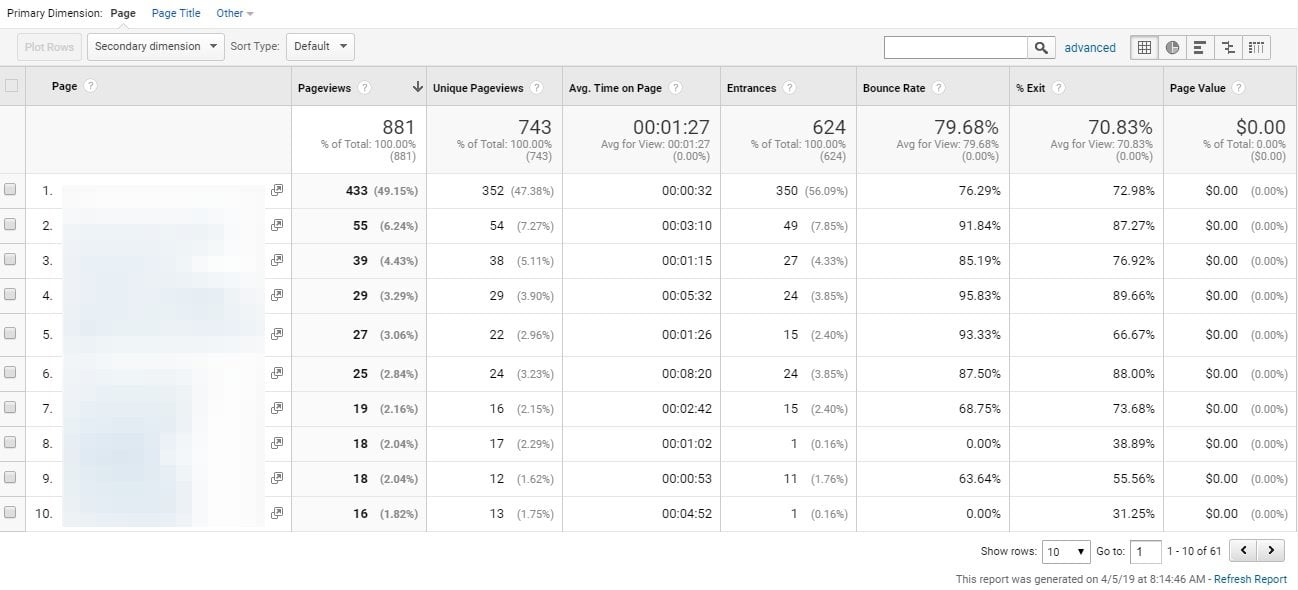
You can drill down deeper to see which pieces of content are performing the best by clicking “Behavior,” “Site content,” and “All Pages.”
3. Bounce rate
Bounce rate is the amount of users that land on your website and leave without viewing another page.
Seeing as 9 out of 10 users will bounce from a page, don’t be upset if you have a high bounce rate.
It’s something that can be easily improved upon.
Continuing with Google Analytics, you can view from the bounce rate for your website as a whole or individual pages.
If you look at the previous site content image, bounce rate is the 6th column.
But why do people bounce from a website?
First, understand that the average bounce rate for a blog is 70-90%. Users search for something on Google, read an article, and leave after they have their answer.
It’s as simple as that.
With these numbers in mind, you can use bounce rate as a content KPI and benchmark.
Some of the main ways to improve bounce rate include the following.
Increase page speed
If your website has a slow page speed, people will be twiddling their thumbs like Homer Simpson.
It’s been proven that the longer it takes for a page to load, the more likely users are to leave.
This also means that it’s an easy fix for bounce rate issues.
Speeding up a website is as easy as using a free tool like Pingdom.
Enter in the URL of your web property, select a timezone, and hit enter!
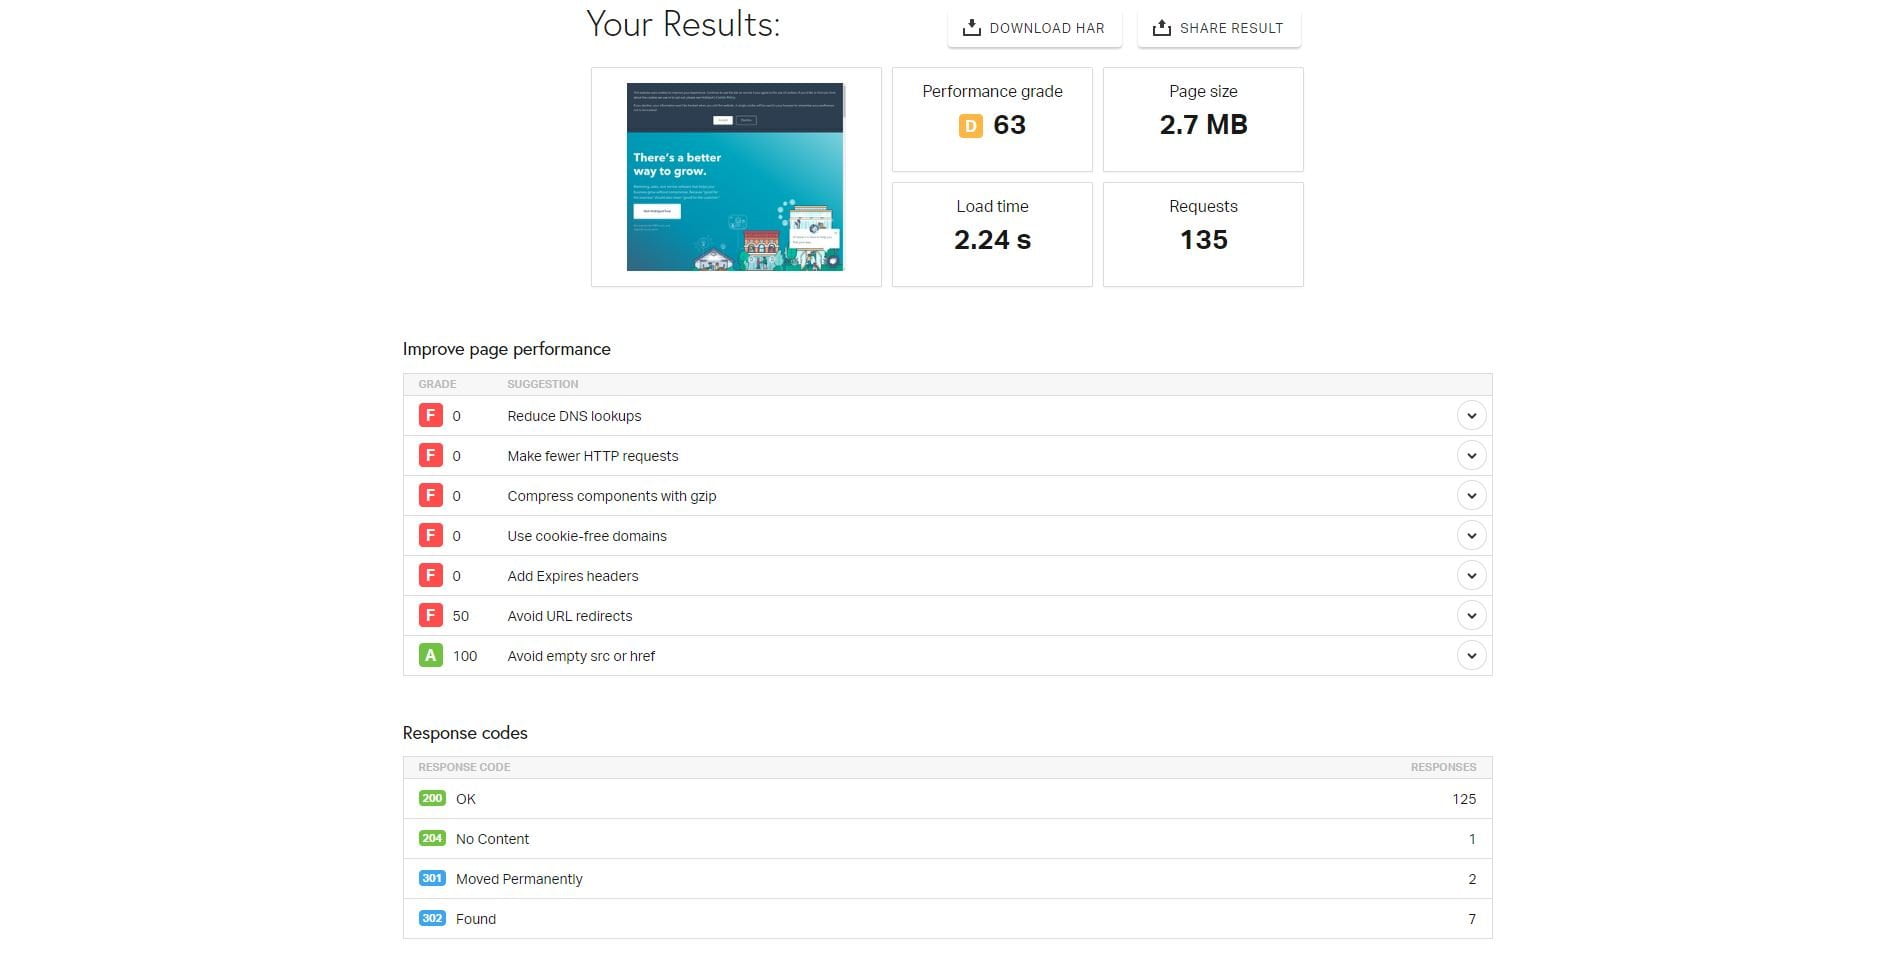
Your website will be given a performance grade. Let’s hope it’s better than your highschool grades 😉
It also details the page size, load time, how many requests were made, and a detailed breakdown of how everything can be improved.
Use this as a way to diagnose any speed issues, and fix them accordingly.
Include more internal links
Linking to other pages on your website is a mandatory SEO practice but also provides further resources for readers.
It helps them stay on your website longer and reduces bounce rate as a result.
Don’t link to other pages for the heck of it though.
Share content that is contextual and use exact match anchor text to boost keyword rankings.
I also recommend explaining what they are clicking.
Sure, standard hyperlinks work and great at that. But you can increase CTR tenfold by saying “You’re going to learn X” or “Get such and such” by clicking a link.
It provides context and they understand exactly where the link will take them instead of it being a mystery.
Place clear CTAs on every page
This is similar to internal linking but has a different goal so I wanted to separate them.
Every piece of content needs a clear call to action
It can be to download a lead magnet, book a consultation, sign up for a webinar, or any other important activities that relate to the topic.
Ideally, it should be used to get users from the top of the funnel into the middle.
That’s why gated case studies, whitepapers, and other MOF lead magnets perform well when embedded in blog posts.
4. Average time spent on page
If users only spend a few seconds on your website, what does it say about the content?
Average time spent on page is a very important content marketing metric, as it implies many things about content quality and user experience.
You have to keep in mind that Google looks at these UX based metrics as a part of their ranking system, as well.
If a website has users staying on it for longer periods of time, it must be useful, right?
Average time spent on page can be viewed via Google Analytics or similar tools.
However, most users aren’t reading content word by word. They skim through to find what they need, using headers, images, and other visual queues as guides.
Think about yourself when you read articles or other material. How often do you scroll down the page and find exactly what you’re looking for?
I know that I do it every day, and you most likely do, too.
With that being said, average time spent on page is important, but it can be lower than expected at times because of this.
5. Click-through rate
Click-through rate, or CTR for short, is the measurement between how often your search engine listing is viewed versus clicked.
You can check the CTR of your website’s pages through Google Search Console.
Connect your website, and then click the “Performance” tab. The average CTR will be displayed alongside total clicks, impressions, and average search position.
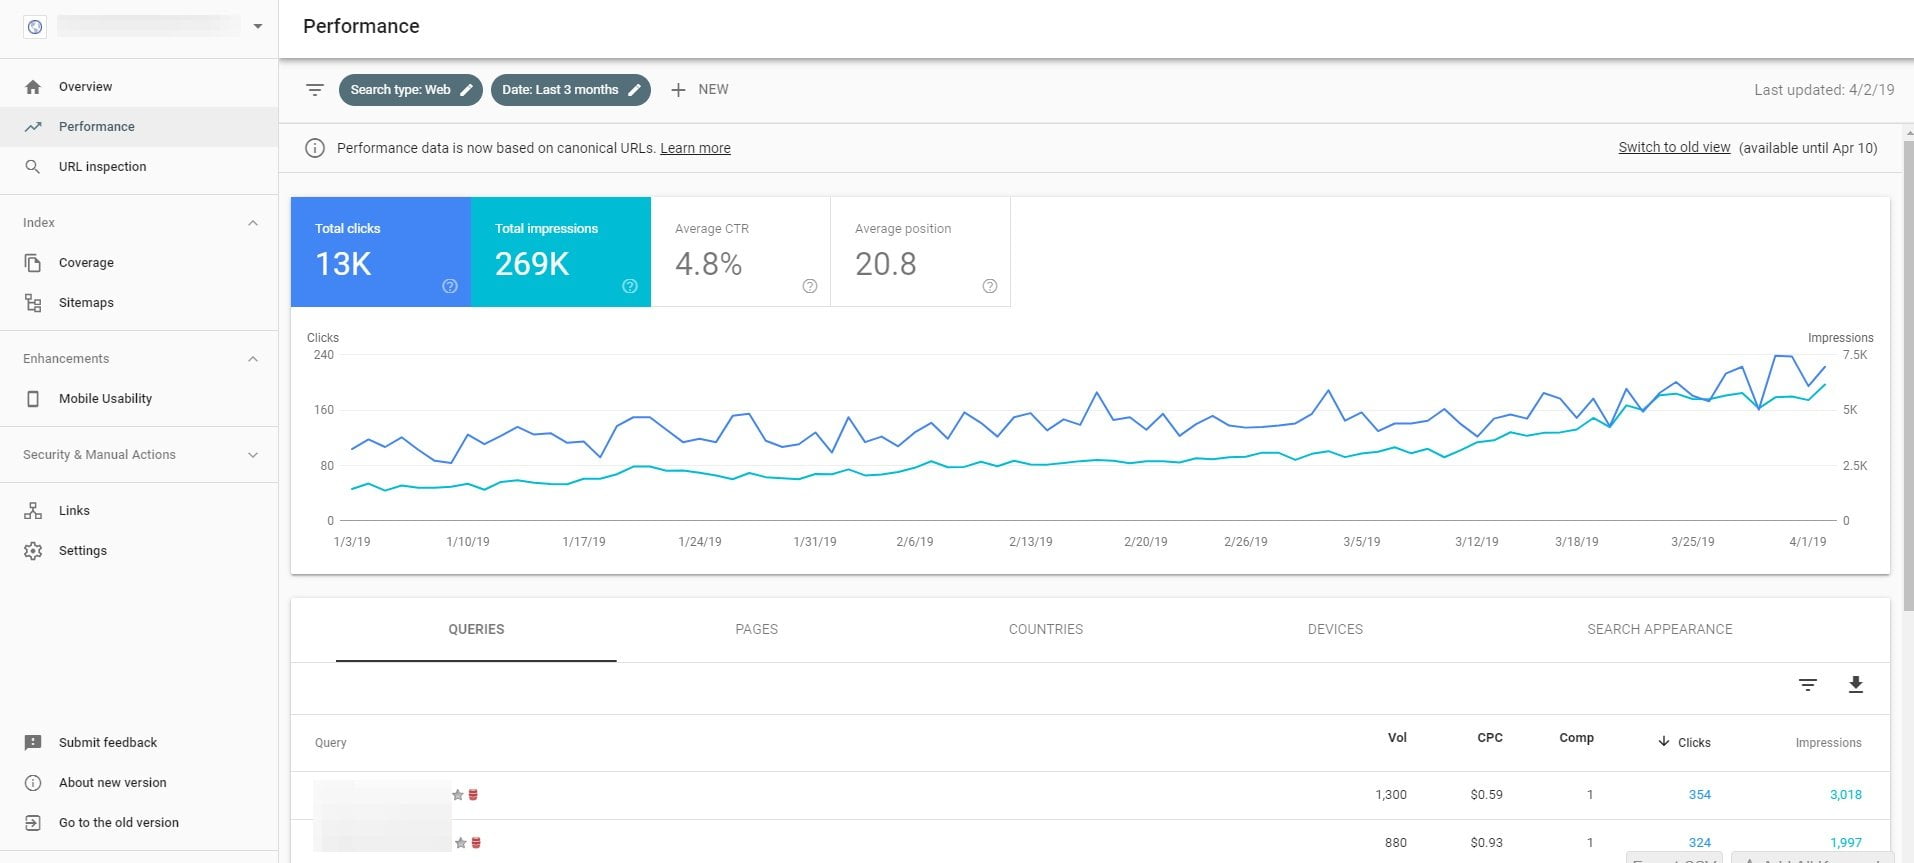
The average click-through rates for websites tends to be in the 2-3% range. Use that as a benchmark to compare how your website is performing.
If you see that the CTR is lower than average, consider doing the following:
- Crafting better headlines that resonate with users and search intent.
- Writing interesting and compelling meta descriptions.
- Including the main keyword in the meta description, so it becomes bold and attracts clicks.
6. Social shares
Seth Godin, one of the world’s most successful marketers, believes that you if create something epic enough it will be shared and go viral.
It’s the nature of good products and content.
That should be one of your main goals every time you produce a piece of content: to make it so damn good, people can’t help but share it with friends.
You can listen to Seth touch on this in-depth in a Ted talk he did.
I’d recommend using a free website like SharesCount that allows you to track how many social shares individual pages have recieved.
Simply enter a URL and hit the “Count Shares” button.

It will then display the amount of shares it’s received on various networks.
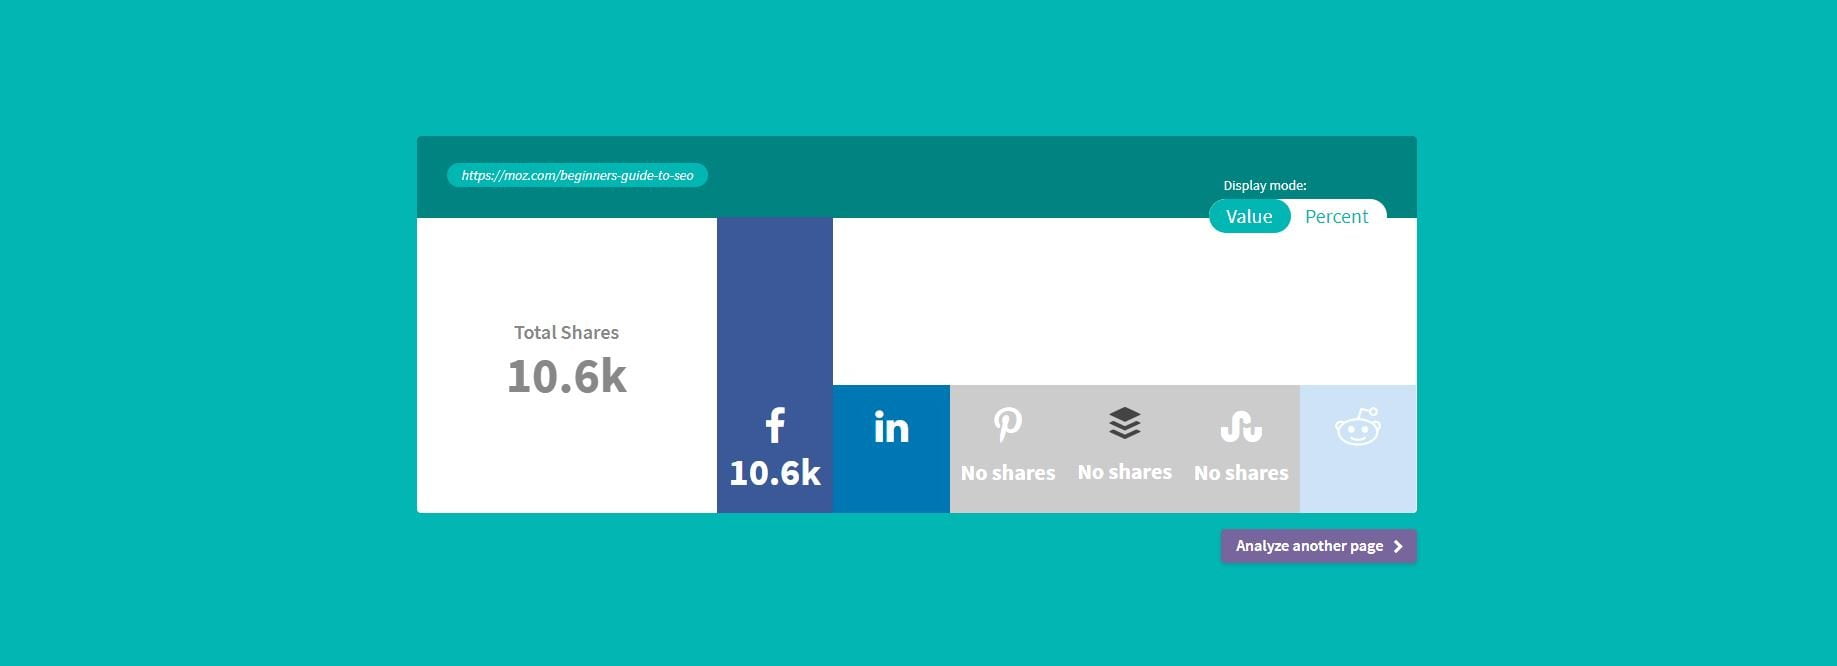
Platforms like WordPress have themes and plugins with social sharing already built into them, so keep an eye out if you can track shares without the need for external tools.
7. Email signups
Good content marketing is connected to a lead generation funnel.
That’s one of the main reasons you’re producing content to begin with, right?
Content that targets a buyers persona attracts high quality users, but you need to capture them, too.
Otherwise, you look like Link trying to capture a fairy in Legend of Zelda.
This is why email signups, which is at the core of most lead gen funnels, is an important metric to track within content marketing campaigns.
You can track email signups through software like Aweber, Mailchimp, and others. All of these services have built-in analytic systems to measure performance.
8. Traffic sources
Businesses tend to drive traffic from different several sources. Sure, one might be carrying the weight, but if you research where your web traffic is coming from you will be able to notice trends.
Navigate to the “Acquisition” panel on Google Analytics, then select “All Traffic” and “Channels.”
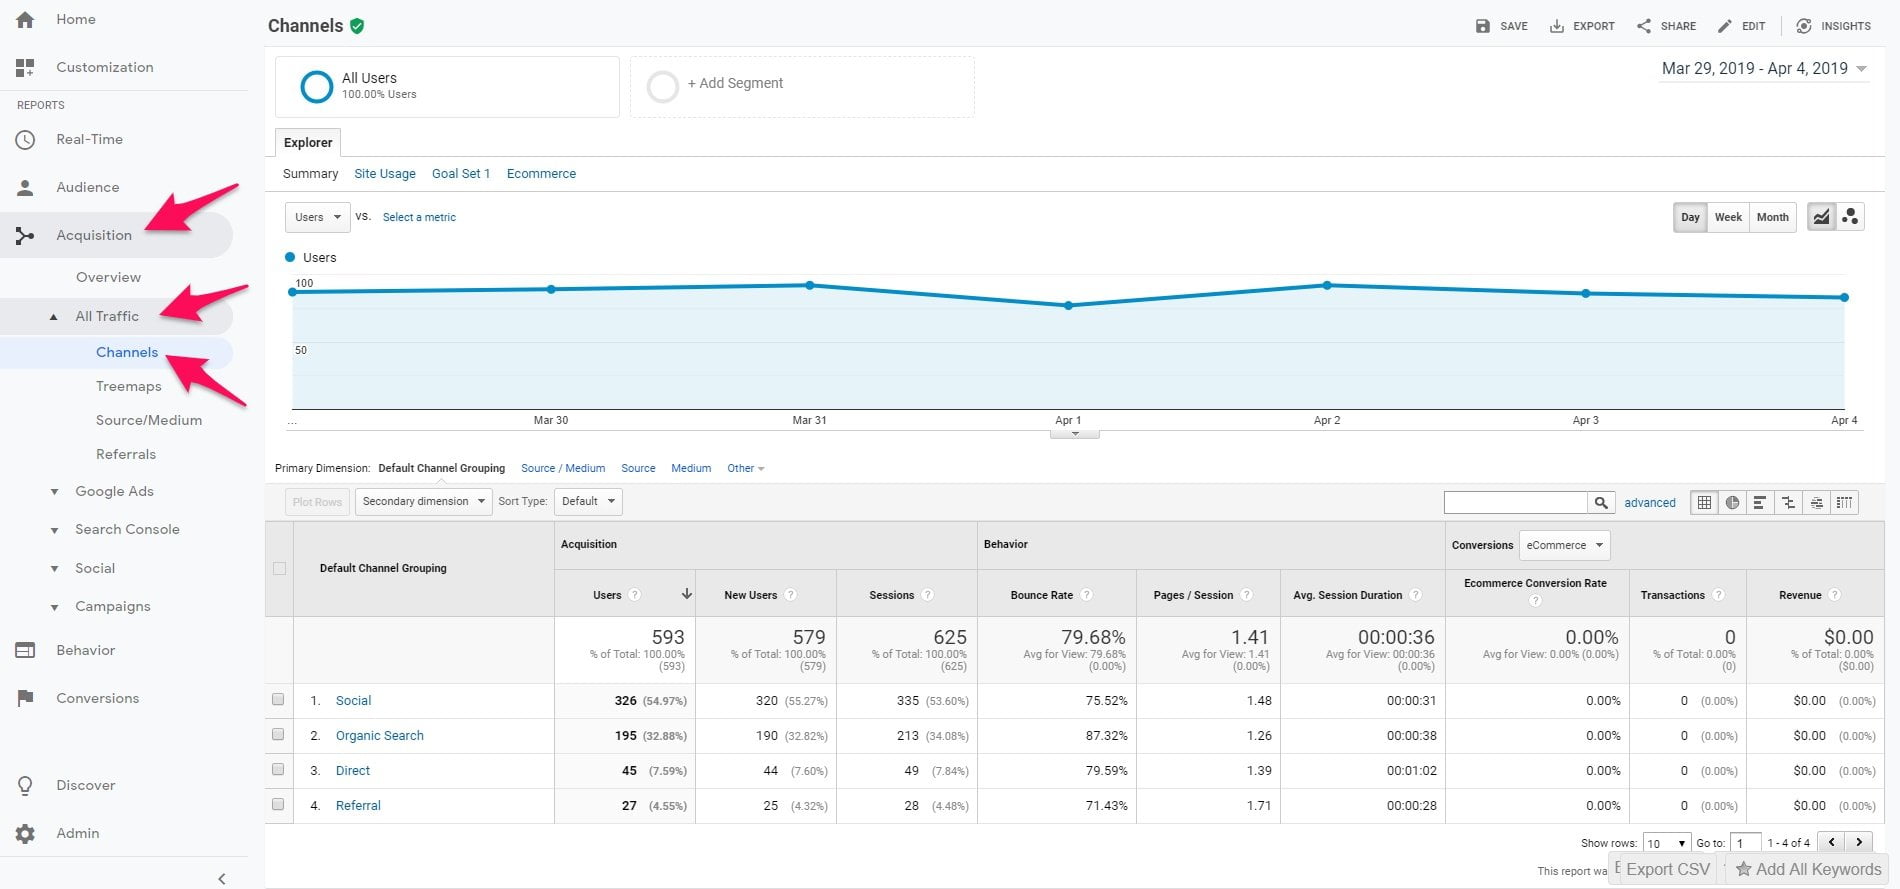
Use this data to understand which channels are generating your website the most traffic.
Consider using Pareto’s Principle, which is the idea that you should focus on the 20% of actions which are driving 80% of results.
If you notice that organic search and Pinterest are the highest quality traffic sources, double down on those.
Don’t neglect other platforms you use, but don’t give them as much priority, for example.
9. Number of articles published
Marketers need to set a goal for every content campaign, and I believe that one of them should be X amount of articles published.
This goal might be for every day, week, month, quarter, year, or more. Whatever suits your individual campaign.
Ensure that you have a consistent publishing schedule, and can clearly measure how much content you’re putting out.
While quality over quantity is the name of the game, you can’t go wrong with hitting a critical mass.
The more content you make, the more opportunities you’re creating to rank for search terms, drive traffic, and ultimately acquire leads.
10. Top viewed pieces of content
Piggybacking off of other KPIs I’ve touched on today, I’d also like to mention that your most viewed content is a huge indicator to watch.
If certain pieces of content are performing much better than others, it can be a sign that you need to produce more of that style.
For example, you may notice that guides and how-to style articles are blowing infographics and videos out of the water.
In that case, it’d be wise to create more guides, since that’s clearly what your users enjoy more.
Furthermore, great performing content could give insight into what tone, layout, and other aspects work best.
You can discover your most popular content by connecting your site to Google Search Console, choosing the property, and clicking the “Performance” page.
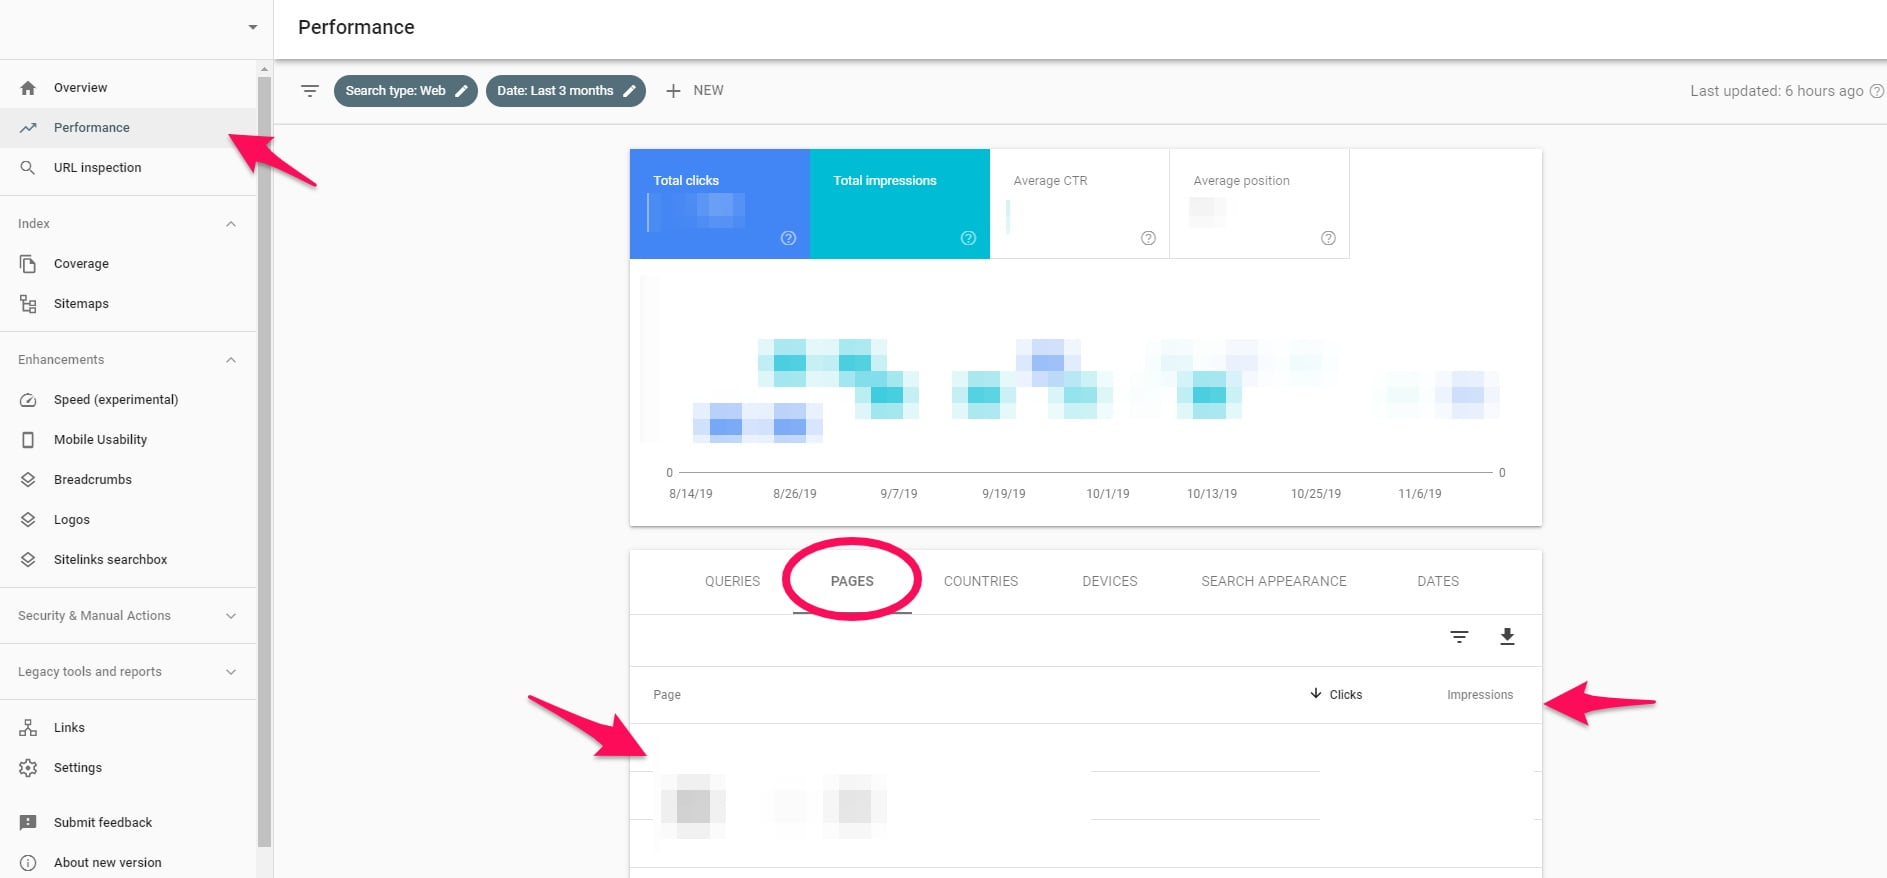
Select the “Pages” tab and you will receive a list of the most viewed and clicked pages on your website.
Not only can this data be used to improve click-through rate and internal linking to pass SEO juice, but once again gives you insight into what content to produce in the future.
11. Marketing qualified leads
You’re not producing content for no reason.
At least, I hope not!
Quality content + a funnel = $$$.
Together they drive traffic to a website and collect leads information to re-market them.
As a matter of fact, content marketing generates three times as many leads as PPC.
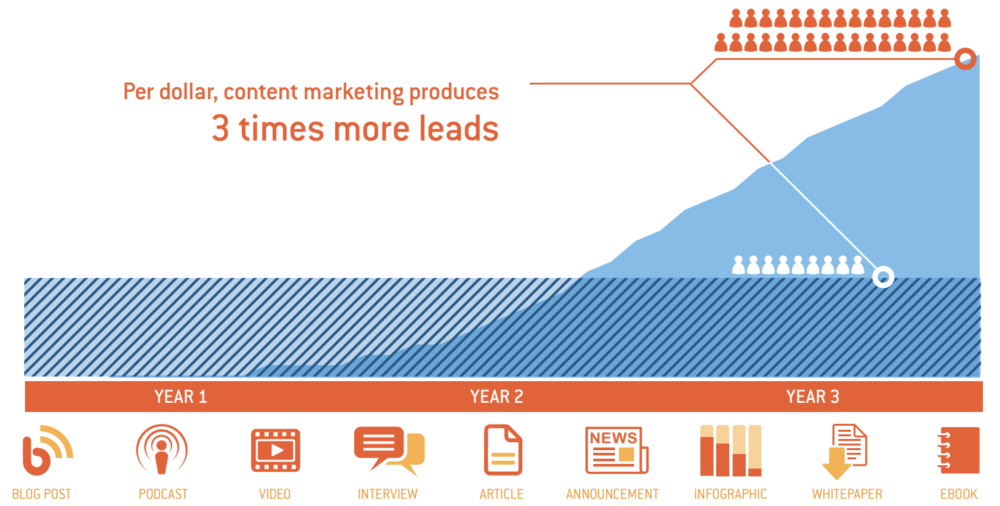
That’s presuming you do it correctly though.
The first step is producing content that attracts your ICP (ideal client profile).
Target topics and keywords that improve their lives, solve their problems, and answer their questions.
Then you need a funnel for leads to slide down.
Blog posts are the top. Next comes gated assets like e-books, checklists, whitepapers, case studies, etc.
These should require an email subscription or other information to be received.
Content marketers can then re-market to them in the backend with drip campaigns and close them with a consultation, demo, or other offer.
Ensure that your team is tracking how many MQLs content is driving every month through a marketing automation dashboard.
This ensures that you are able to accurately measure content marketing ROI.
12. Scroll depth
Do you know how far readers are scrolling through content and pages?
If not, you’re missing out on some seriously lucrative data for measuring the impact of content marketing.
Knowing scroll depth helps you address content and user experience issues that you may not find otherwise.
I like using Hotjar and CrazyEgg is popular as well.
Improving UX and content quality means more readers get through the content.
And, that means more leads and action being taken on your website which translate into revenue.
It’s as simple as that.
Get set up with a heat map tool—Hotjar is completely free for example.
Where are people getting stuck on content?
Perhaps the page is too slow, you’re not speaking in their language, or it doesn’t match search intent.
Test changes to the content in problem areas and see if scroll depth improves.
13. Comments
Comments require a commitment from readers to engage with your content.
Think of it as measuring the impact content has on a reader to encourage them to leave their thoughts.
Additionally, it adds new life and content to a page.
Other readers can view the comments of others, often adding hundreds to thousands of words of dialogue for them to read.
This, as a result, can help improve average time on page, bounce rate, and trust.
Please keep in mind that it’s very likely you’ll receive bots and spam, so use a plugin (presuming you’re on WordPress) to moderate comments before they’re published.
14. Keyword rankings
SEO and content go together like steak and wine.
If you aren’t optimizing every piece of content for Google, you’re losing out on free traffic and brand awareness.
Use a keyword research tool like Scout Suggest for ideas.
Type in a phrase related to the piece of content you’re producing and click “Go.”
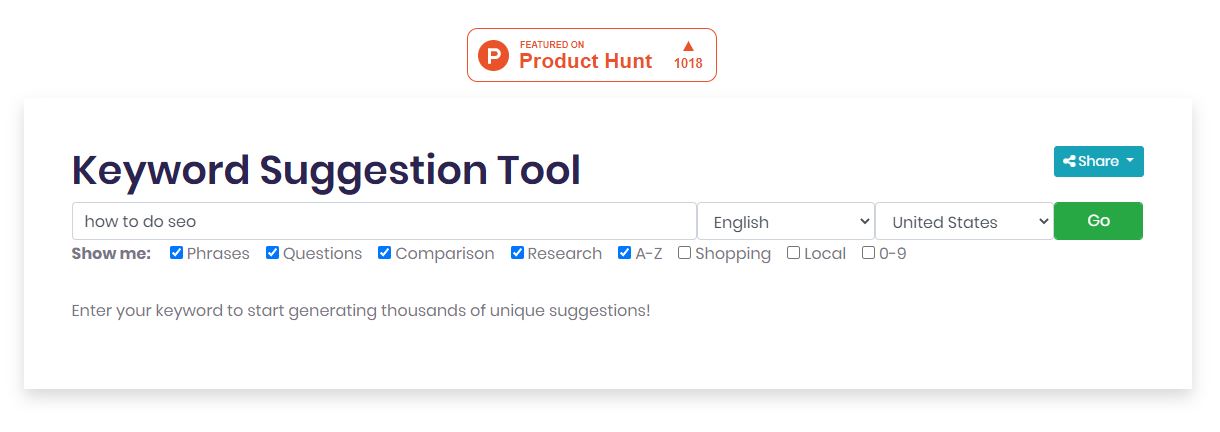
This will give you keyword suggestions that you can copy to clipboard or export as CSV.
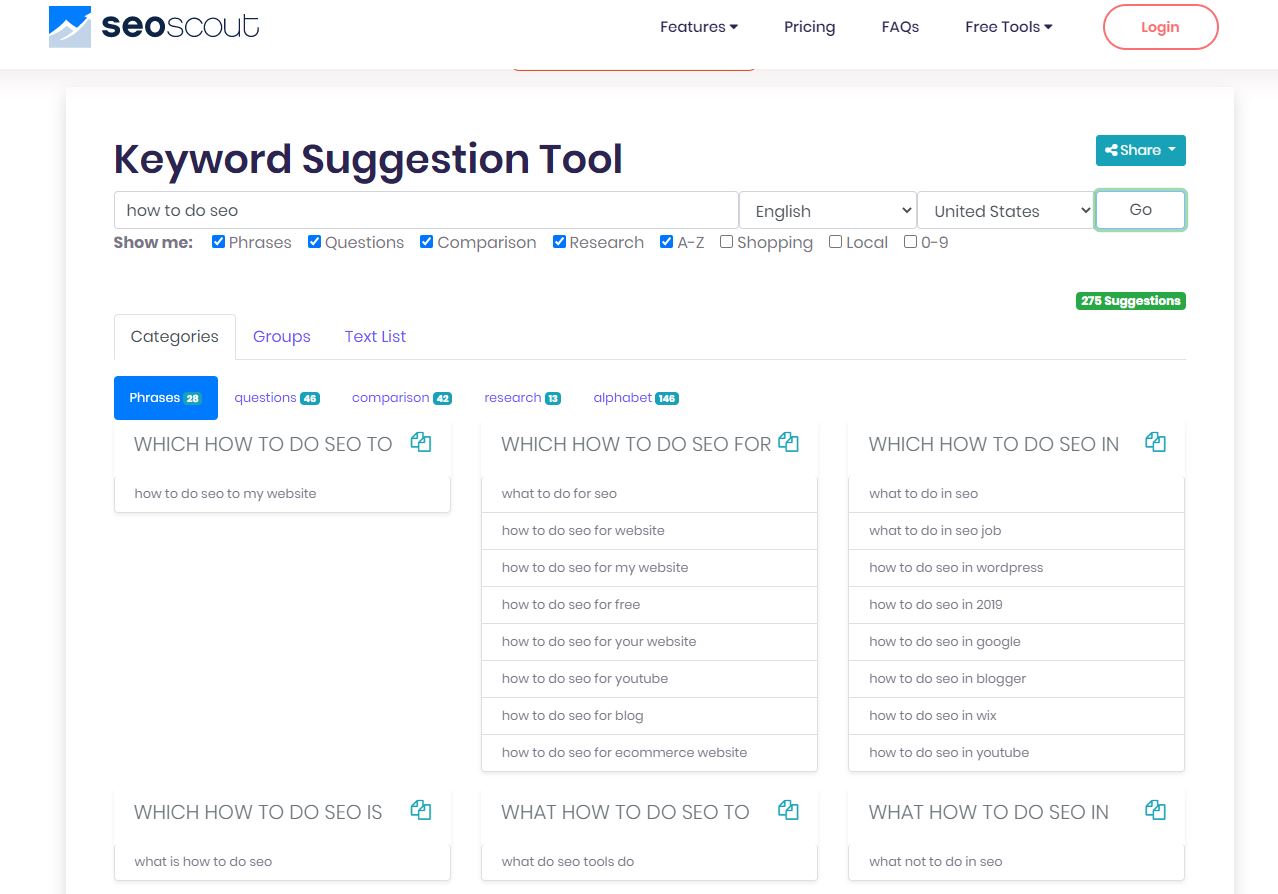
Place the main phrase within the title, meta description, URL, header tags, and alt text of media.
Then you need to track them.
One of the most bare-bones ways to do so is simply searching for the main keyword and seeing where you rank on Google.
Since we’re not cavemen though, use a suite like SEMrush or Ahrefs to keep constant tabs on where you are in the SERPs.
Wrapping up content marketing campaign KPIs
I commend you for diving into content marketing and making the internet a better place.
But if you want to see the results I know you want out of content campaigns, it’s crucial to set a few KPIs.
Choosing content KPIs begins with auditing what’s important for your business and campaign.
Is it organic traffic? Leads? SEO improvements? These elements will change how you measure content campaigns, but some metrics are universal.
Here’s a wrap-up of the KPIs for content marketing we took a look at today.
- Track how many backlinks your content is receiving, whether or not you build links manually or not. Tracking domain/page authority is also wise.
- Use a tool like Google Analytics to watch how your organic traffic is being effected by content marketing.
- Analyze the bounce rate of your website and individual pages.
- Average time spent on page can offer insight into how users are interacting with content.
- While high bounce rates aren’t uncommon, strive to reduce it, and keep users on the website longer.
- Use Google Search Console to determine the average CTR of your search listings and optimize them.
- Pay attention to how many social shares your content is receiving. Use calls to action or more prominent sharing buttons to increase this metric.
- Email newsletter signups should be measured, since lead generation goes hand-in-hand with content marketing.
- Study which traffic sources make up the bulk of your user base.
- Examine the most popular content you’ve published, and breakdown why it’s performing so well to mimic this again with future content.
Additionally, feel free to reach out to me if you require a content writer for hire.
