
How do you know whether or not your copywriting is moving the needle?
With a little something called key performance indicators.
They are quantifiable metrics that determine if the sales copy is contributing to a certain outcome.
For some projects, it’s revenue.
…For others, it’s leads.
…Brand awareness.
…Direct sales.
But, do you know what the problem is?
A lot of copywriters don’t measure their writing. It’s a huge mistake.

Being able to measure sales copy means you can deliver better client reporting and create tests to find winning combinations of copy.
Stick around. I’m going to share my top ten copywriting KPIs ahead.
1. Sales
One of the most important KPIs copywriters need to measure is sales … revenue … moola … Benjamin’s. Whatever you’d like to call it.
All in all, it’s the money and sales coming in from the copy you’ve written.
If you write the sales copy for a direct response campaign, the product is $250, and it generates 1,000 orders. That’s $250,000. Plain and simple.
Take the sales page for the web design course WyseBox as an example. It’s priced at $497. They could tweak the copy and simply observe how sales change.

That’s also why I want to bring in another not-so-known metric called average sales price.
Average sales price (can also be called cart value) is the average amount a customer spends at once. If you or your client has several pricing tiers, discounts, and so forth (ways to change the average price), this needs to be measured.
Let me give you an example. Imagine that we’re selling a product like a weight loss pill with three different pricing options: five bottles for $50, ten bottles for $90, and fifteen bottles for $120.
Resurge is a perfect example.
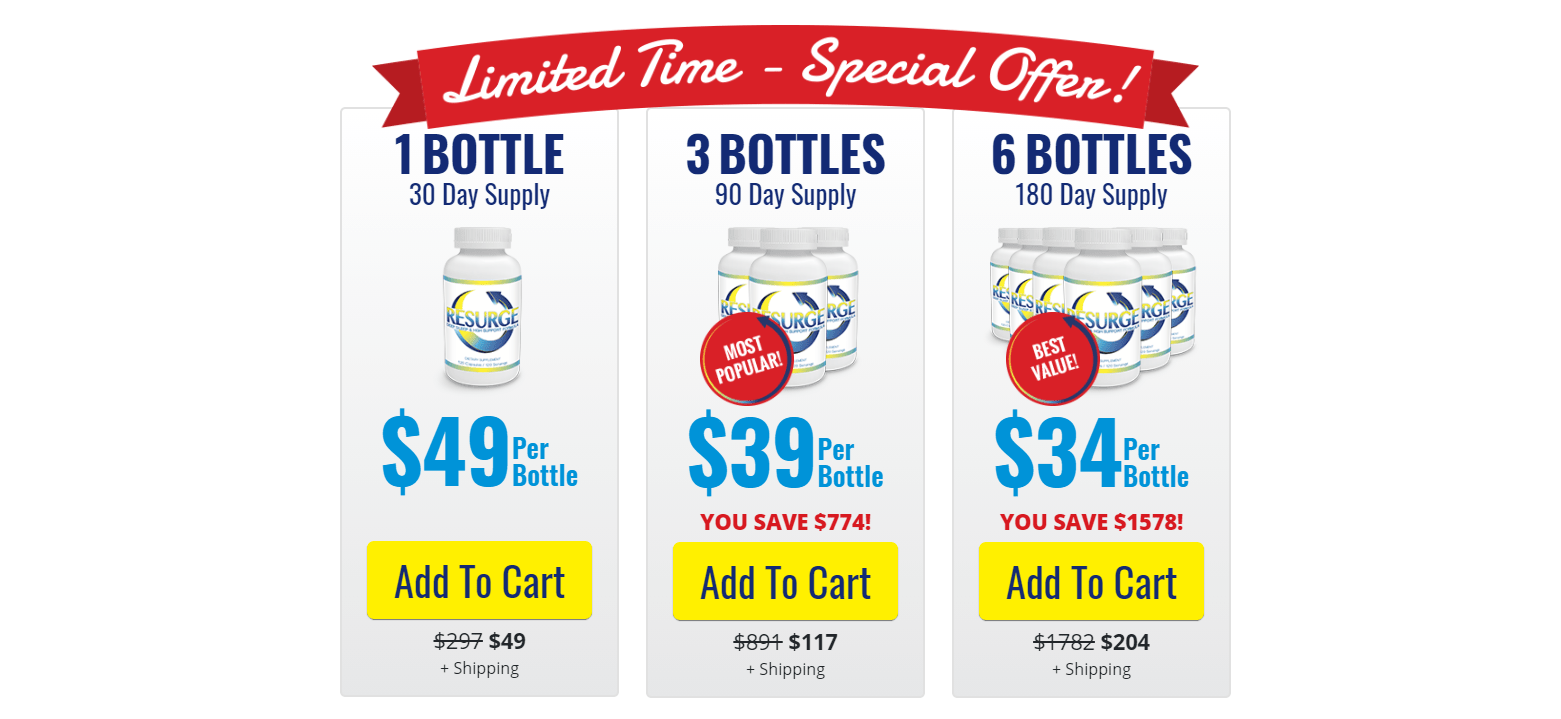
We discovered in the first campaign that the average sales price was $50 (mostly coming from the first plan).
The next time, we test new sales copy against the control that focuses on pushing the benefits of the higher-priced plans.
Bingo! The average sales price increases because more customers purchase pricier plans.
So, the average sales price is primarily measured when there are multiple price points for a single product.
That brings me to my next point.
2. Leads
Some copywriting campaigns aren’t trying to generate direct sales but something similar: leads.
Leads are potential customers. They are also called prospects.
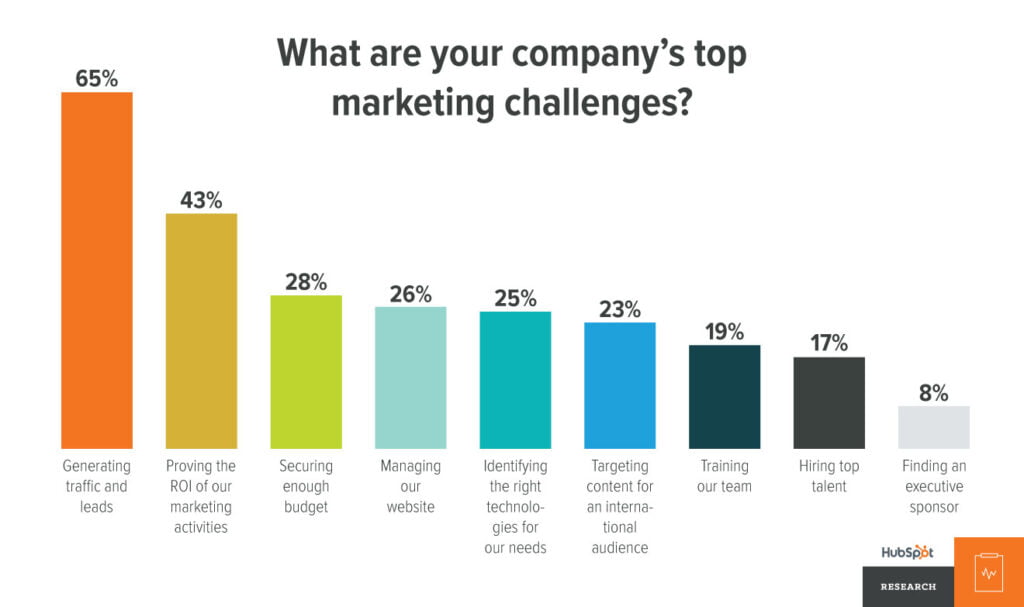
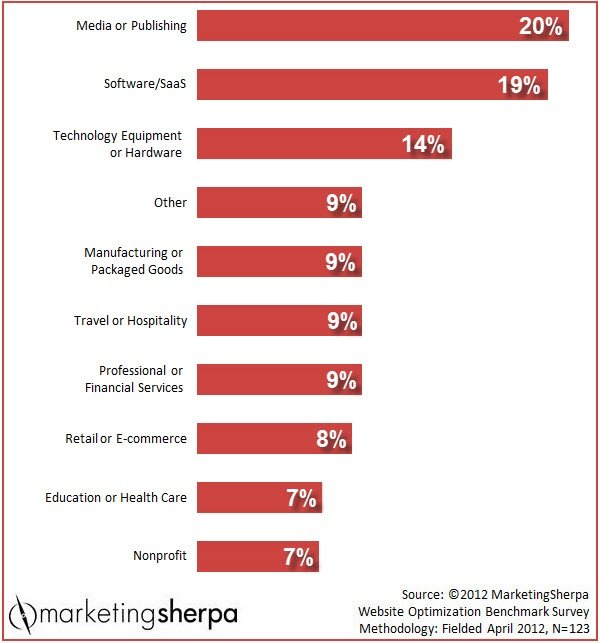
65% of companies say that generating traffic and leads are their top challenges.
This is because people don’t just give up their information at the snap of a finger. Not even close.
We’re in a time of browser cookies, tracking, smartphones, and people being protective of their data.
Because of this, you have to offer something in exchange or their information to build trust and barter a good deal.
This is what we call a lead magnet. It’s a free resource like an e-book, report, case study, template, course, etc.
It should directly relate to the offer you plan to upsell the prospect on later. I call this a smart lead magnet.
It’s not generic or made for everyone. It’s tailored to a specific audience and problem.
Check out LeadJolt. The real estate marketing company offers a free training video in exchange for the prospect’s information.

Leads are pretty easy to measure with this in mind.
You launch a campaign, measure how many leads are generated, and test components like the sales copy or lead magnet.
3. Conversion rate
No matter what you’re promoting and writing sales copy for, conversion rates MUST be tracked.
But what exactly is a conversion?
It is the number of people that convert divided by the total number of interactions.
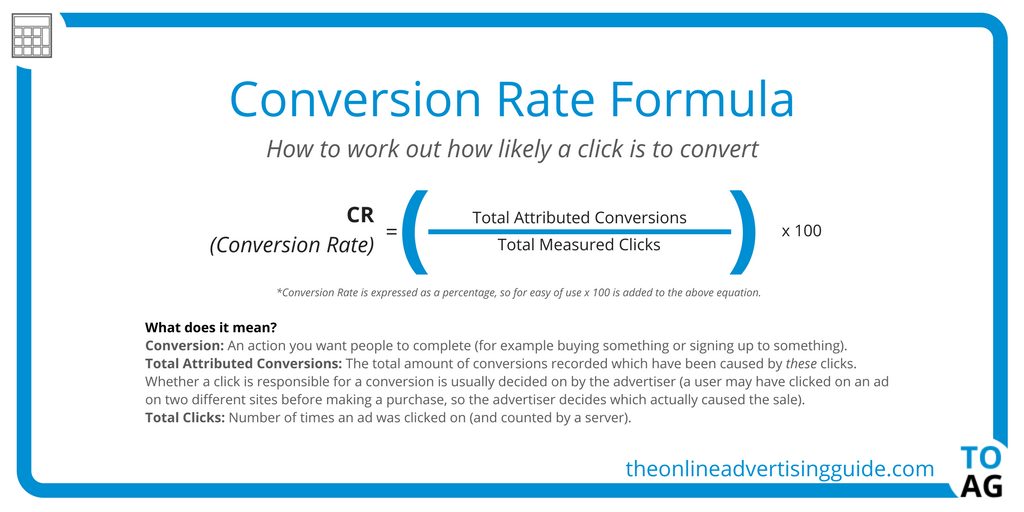
Let’s say that you are trying to generate sales for an e-commerce company.
You drive 100,000 users to a new promotion, and over the lifetime of the campaign, there are 3,000 customers. That means 3% converted.
And what exactly is a good conversion rate? Let’s take a look at some industry benchmarks.
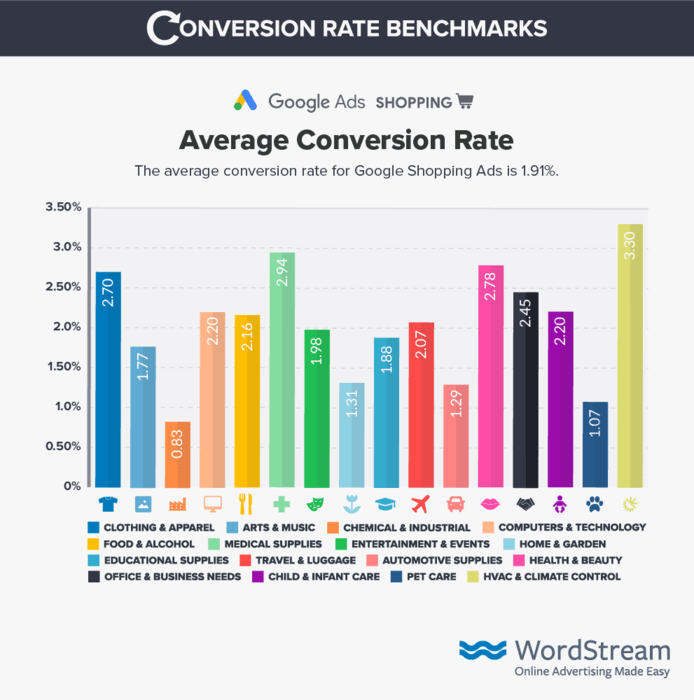
The highest conversions are 3.30% (HVAC), 2.94% (Medical), and 2.78% (Health & Beauty).
The wonderful thing about conversion rate optimization is that you don’t need any more traffic, a different audience, etc. You simply tweak the offer and sales copy, and viola! More results.
4. Click-through rate
Click-through rate, or CTR for short, is the number of users who click a link to another page.

This can be applied to anything from email newsletters to PPC ads.
Any campaign that includes links that push users deeper into a sales funnel needs to measure the click-through rate.
After all, rarely are you going to ever measure one KPI.
You can take any of the ten copywriting metrics I’m covering today and combine them in every project.
Click-through rates can be high as 20% or low as 7% depending on the industry.
But how can you further increase CTR? A few ways.
The first strategy is to refine the offer. Customers need a clear benefit and incentive for clicking through and investing their time to learn more.
This normally includes improved health, finances, relationships, etc. It will change depending on the exact product and audience, but you get the point.
This is a Facebook ad for a wallet sold by the company Bellroy:

It clearly explains that the customer will receive a slimmer and more convenient wallet by clicking through and shopping.
The second strategy is to target the customer’s pain points and use urgency. Make them want to click through to solve their problem.
Address the pain point followed by symptoms. For illustration, this is a landing page for a marketing guide:
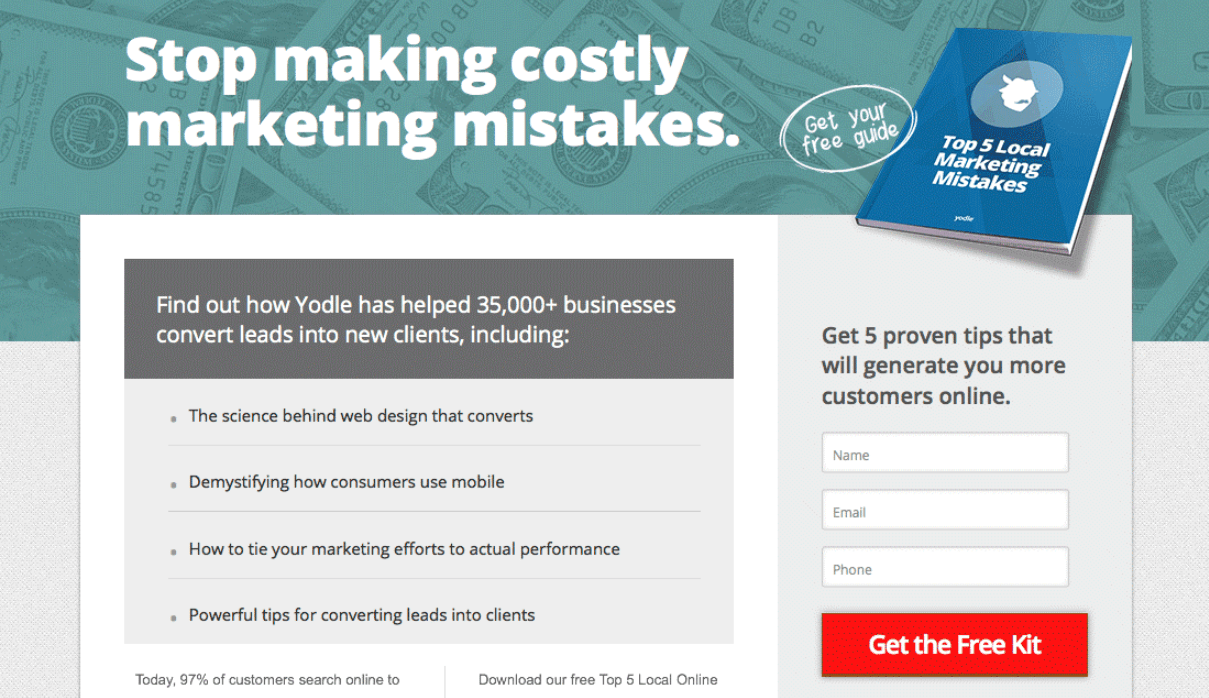
The headline tells the reader to stop making costly marketing mistakes. (A pain point.)
Bullets quickly summarize the benefits of getting the free report, like tips for converting leads and how to measure performance. (Sound familiar?)
5. Open rate
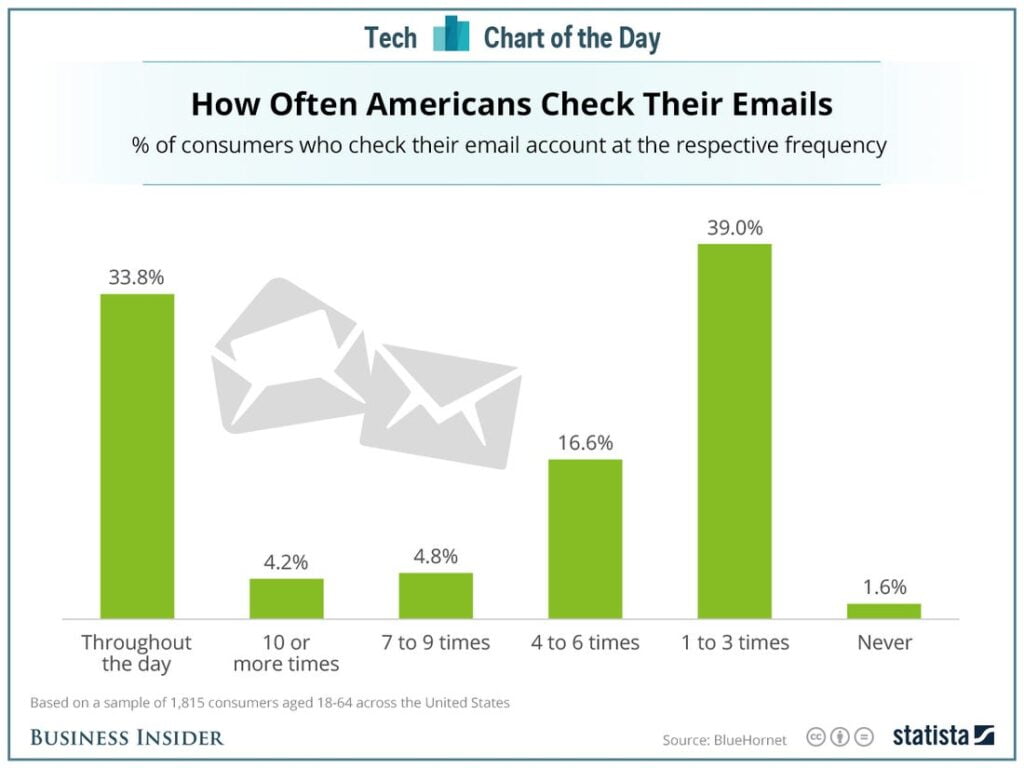
The next two copywriting KPIs are email focused. After all, email is the most widely used source of communication.
As a matter of fact, Americans check their emails one to three timers per day.
Think of corporate emails, personal emails, and newsletters. All of these require excellent subject lines and body copy to maximize performance.
That’s where the open rate comes into the picture.
If people don’t open an email, they can’t click links which means no results are generated. 👎
The average open rate of an email is 15-25%. Not too shabby. But we can raise it a bit.
I’ve written cold email campaigns for clients that had 90%+ open rates. It’s not impossible.
The first step is personalization. Nobody wants to feel like a cog in a wheel. Sending everyone the same subject line will do exactly that sink open rates like the Titanic.
Instead, I want you to include the recipient’s first name, company name, or something else personal.
This makes the email much more genuine and spikes curiosity. “How does this person know me?” “Where did I meet them?” These are a couple of questions people are going to be thinking.
You can also boost email open rates with curiosity. Us humans are naturally intrigued by mystery.
Don’t reveal everything. Otherwise, they have no reason to open the email. Here are a few examples I just made up:
- “This Ancient Greek diet helped her lose 27 lbs”
- “The strategy Neil Patel used to attract one million visitors”
- “How I landed Ford as a client with one email”
The goal is to get people thinking, “How did they do that?” and thus open the email.
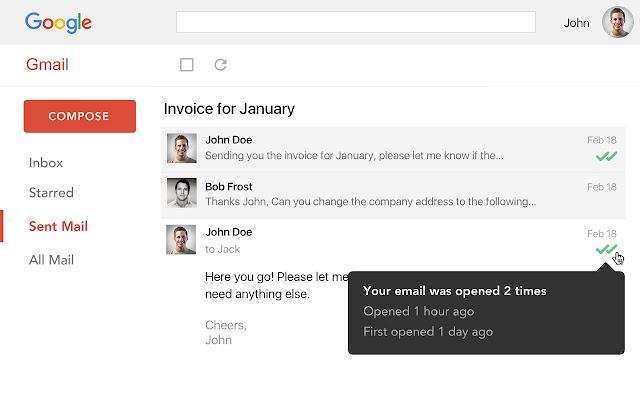
You can track how many people open emails and reply to them (for the next KPI ahead) with a free Google Chrome extension called Mailtrack.
6. Reply rate
Once someone has opened your email, your job is halfway done.
It’s now time for them to read the email, reply, and engage with it.
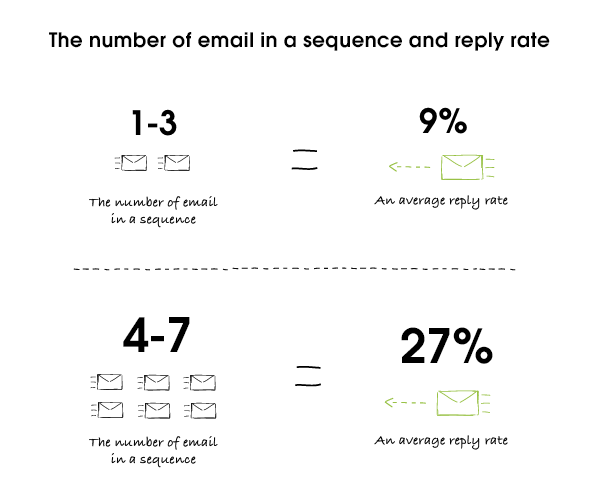
The average reply rate is 27% for sequences that include 4-7 emails. This decreases to 9% when 1-3 emails are used.
Let me explain how to increase reply rates.
The first way to increase reply rates is by simply asking a question.
This prompts the recipient to respond.
Depending on the individual campaign, the question should be personalized to their experience, situation, or problem.
Then the product or service can be positioned as a solution.
Secondly, I recommend using calls to action.
Imagine that you are writing a cold email sequence for Fortune CEOs and trying to book a meeting.
In one of the follow-up emails, you could use a call to action, telling them whether or not a proposed time is good for a phone call.
Once again, you’re putting the ball in their court and awaiting their response.
7. Average session duration
Let’s get into some copywriting metrics for the web, beginning with average session duration.
I help clients drive organic traffic and lead through content writing services.
Naturally, these types of metrics are some of my best friends.
Average session duration is primarily used to measure the effectiveness of web pages and blog posts. A.K.A the content on a website as a whole.
As you can guess, the longer the duration, the better. People are navigating through pages, reading content, and staying on the website.
This means that it’s engaging and relevant.
The opposite is true too. Low session duration could mean that the web pages are low quality, unengaging, and not relevant.
But let’s not generalize.
A news or weather website isn’t going to have half of the average time that some blogs do for example. (Check out my blog post idea generator!)
The average user is going to read a quick article or check the weather and be gone.
Others will be spending five to ten minutes or longer reading long-form blogs.
You can measure this copywriting KPI by connecting Google Analytics to the given website and visiting the “All Pages” section under “Behaviour.”
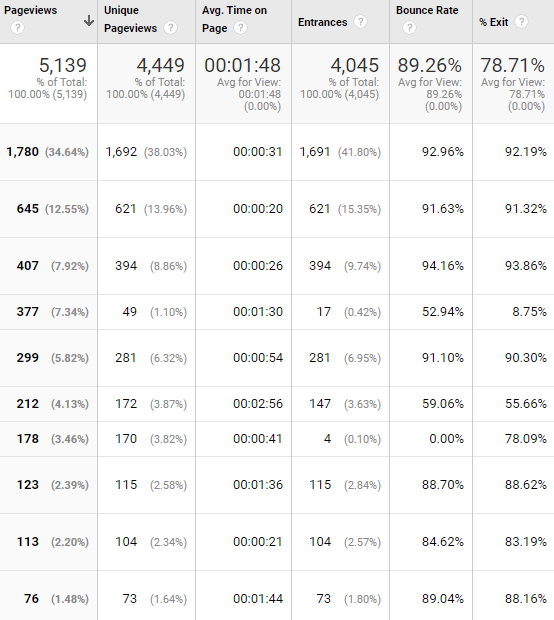
It is believed that an average session duration of two minutes or more is the golden range.
Lower? Work on the quality of the content, user experience, and page speed.
Higher? Keep doing what you’re doing!
8. Pages per session
Similar to the average session duration is pages per session. It measures how many pages a visitor views in a single browser session.
The more, the merrier.
If a user visits several pages, it’s a sign that the content is relevant, contextual, and high-quality.
Otherwise, it could mean you’re speaking to the wrong audience, or the web copy needs some tweaking.
Navigate to “Overview” under “Audience” on Google Analytics to view this metric.
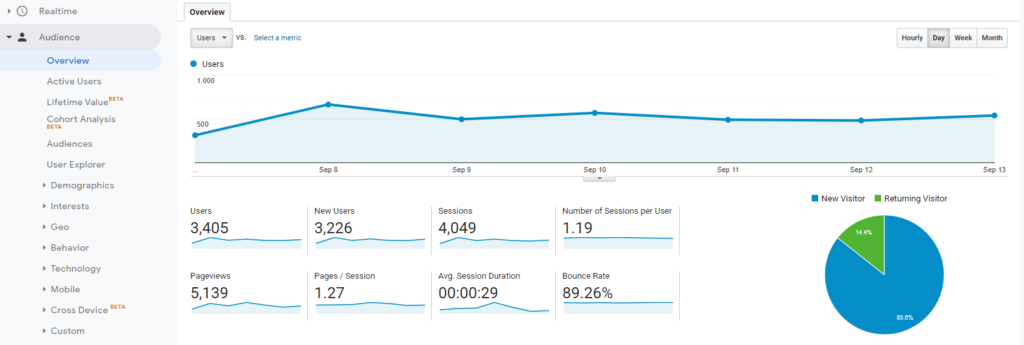
The unofficial industry standard is 2 pages per session. This means that readers are interested in navigating to other parts of a website.
It can be increased by firstly adding more internal links. Doing so helps push users further into a website.
Secondly, use more calls to action. Tell readers to download resources, visit services, pages, etc.
Thirdly, the navigation should be easy to access from both desktop and mobile.
9. Bounce rate
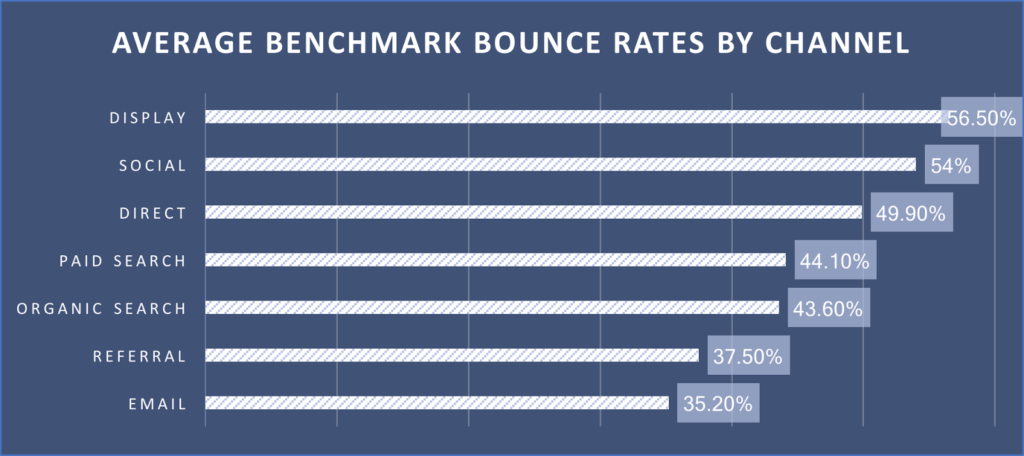
Bounce rate is the number of users who visit a website without navigating to another page.
The average bounce rate for display traffic is 56.50%.
So, don’t sweat bullets if your bounce rate is very high.
The lower the bounce rate you can get, the more users are getting deeper into the funnel and potentially converting.
I first recommend speeding up your website or other assets.
Clunky websites and sales pages will annoy users and make them leave out of frustration. Use a service like GTmetrix to find bottlenecks in UX and page speed.
Then, make sure that you are driving relevant traffic.
If we’re talking about organic, match the search intent and answer their questions as best as possible. Otherwise, they will leave for another search result.
For paid traffic, match the ad to the landing page as closely as possible.
10. Traffic
Traffic is a weird one. You see, I once read a book called The Lean Startup, and it had an interesting view on this KPI.
The author summed up website traffic as a vanity metric. You know … one that looks … feels good …. but doesn’t actually mean much.
For example, imagine that you were receiving one million visitors per year to your website.
Sound cool, right?
Well, slow down.
If your conversion rate and other web metrics stink, that waterfall of traffic isn’t going to do much at all.
That’s why they considered it vanity. It just looks nice.
Instead, you could have 100,000 users per year which drive incredible amounts of revenue because you’ve CRO’d the heck out of every nook and cranny.
With this in mind, measure traffic but realize that generating leads, sales, and conversions matters the most.
It’s also crucial to determine what traffic sources contribute to the above KPIs.
Analyzing this empowers you to focus on traffic sources that drive the most bottom line.
Wrapping up copywriting KPIs
Copywriting needs to be measured.
This ensures that it’s helping achieve a goal.
But, how do you know whether or not your sale copy is moving the needle?
Key performance indicators.
These are metrics that you can measure to quantify the effectiveness of sales copy.
It also helps you test versions of copy against controls to find winners.
To recap on the most important copywriting KPIs:
- Sales
- Leads
- Conversion rate
- Click-through rate
- Open rate
- Reply rate
- Average session duration
- Pages per session
- Bounce rate
- Traffic
To learn more about growing a business through copywriting, check out my online courses.