
Did you know that infographics can increase traffic to a website by 12%?
They are awesome resources for readers, and can be used to connect with industry leaders through outreach.
Infographics can also be used for backlink building campaigns, boosting the authority and rankings of your site.
Have you been feeling confused about how to create an infographic and market it properly?
Don’t worry, I’ve been there, too.
Today I’m going to teach you how to make an infographic quickly, and use it to acquire links and social shares.
What is an infographic?
An infographic is exactly what it sounds like: a graphic which contains information.
It’s different than a chart, graph, or regular image as the goal of an infographic is to combine as much knowledge and resources into one visual.
Here are some examples of what they look like from my Pinterest account.
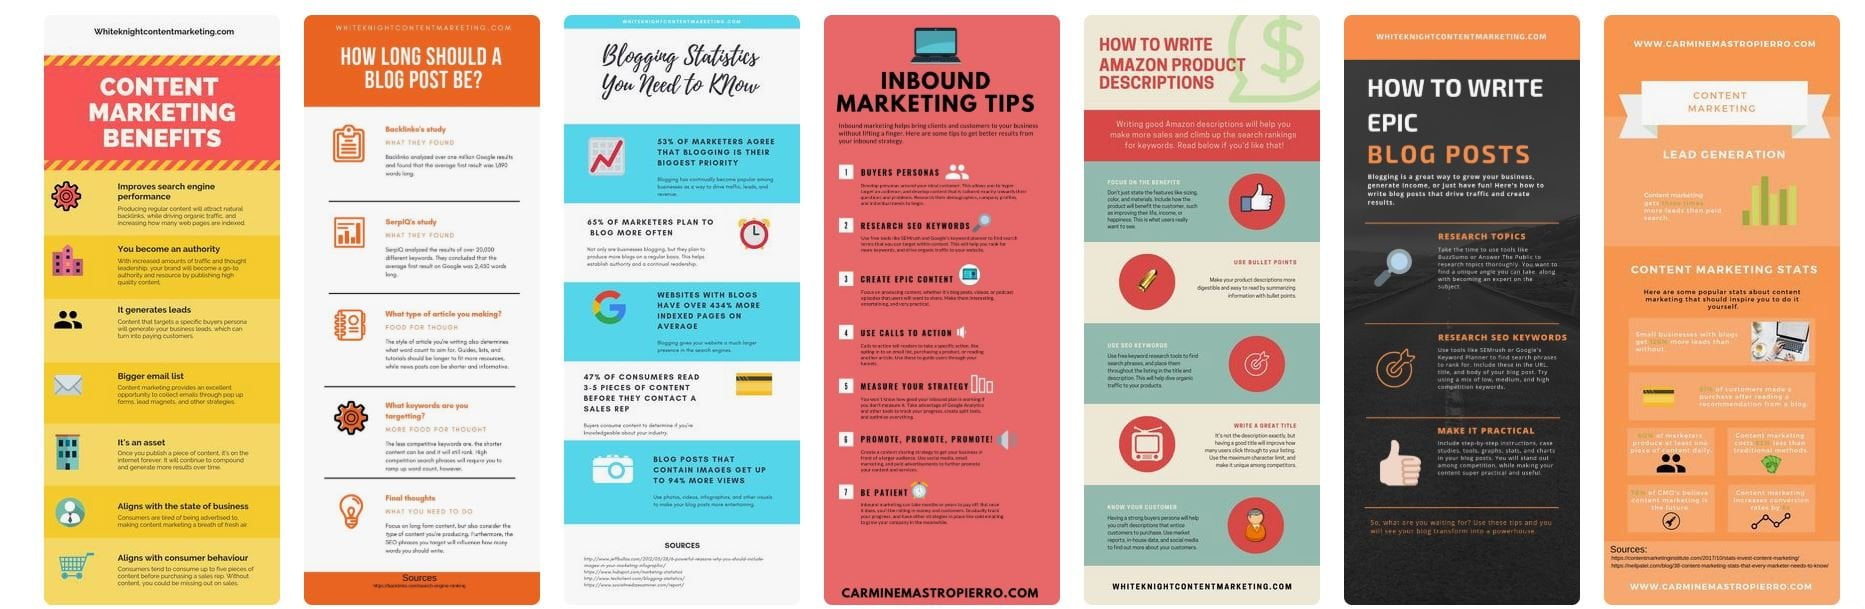
Infographics can be about anything. That means no niche or industry is barred from creating one.
They are perfect for social media, posting on a blog, or including in other forms of media.
I touched on yesterday that they are also an effective format when repurposing content.
Infographic marketing stats
Now that you know exactly what infographics are, let’s take a look at some interesting stats that speak to their effectiveness.
Users pay close attention to content with images (Source)
An eye-tracking study performed by Nielsen Norman Group found that internet users are much more likely to pay attention to content that includes images.
Similarly, they concluded that some images are completely ignored when they are purely decorative and offer no value. This is why you commonly see the recommendation of never using stock images.
Other types images are heavily scrutinized and prioritized, such as product photos or pictures of people.
65% of B2B marketers create infographics (Source)

According to Content Marketing Institute, 65% of B2B marketers produce infographic for content marketing purposes.
As I stated earlier, these types of graphics are great for promoting social shares, acquiring backlinks, and keeping users on your website.
Illustrations help people follow instructions 323% better than without (Source)
A study performed in 1982 by W. Howard Levie and Richard Lentz in the Educational Technology Research and Development journal found that people follow instructions drastically better when illustrations are provided.
This makes a lot of sense because humans are visual creatures. We create our reality based on what we see and how we personally interpret it.
Images help guide us along steps and instructions as we perform it ourselves, and infographics are no different.
While they typically don’t instruct users on how to do something, although they can, infographics use images to create connections between points and for entertainment.
How to create an infographic
With all that boring stuff out of the way, let’s get into the fun part!
I’m going to show you how to make an infographic with a tool called Canva, although you could use any design tool you enjoy.
You should find that the steps will remain the same no matter what platform you’re on. Let’s get into it 🙂
Step 1: Decide on the goal
Like any part of a content marketing strategy, you need to set a goal first. You never want to begin without something in mind because it will bog down the whole process.
What would you like your infographic to achieve? Are you trying to use it for link building campaigns? Do you want it to solve the reader’s problems?
Normally a graphic of this type is made to summarize useful information into bite sized chunks.
Step 2: Choose the topic
Once the goal is set, marketers then need to choose what topic they would like to make the infographic about.
While you can take the time to analyzer competitors or brainstorm off of the top of your head, I recommend looking at previous content.
This makes coming up with ideas fast, and you get to repurpose existing content.
Step 3: Collect resources
Infographics contain data, charts, and resources to make them more practical. This is why the third step when creating one is to begin collecting references.
I recommend using our good friend Google to search for relevant statistics. If you were creating an infographic about SEO for example, you could search for:
- “SEO statistics”
- “Statistics about SEO”
- “SEO case studies”
- “SEO whitepaper”
Step 4: Use a template
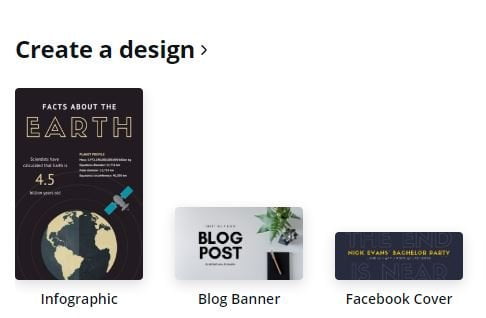
From the dashboard of Canva, choose the “Infographic” option.
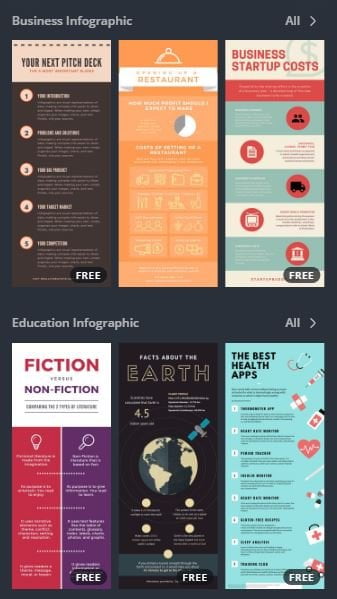
Scroll through the sidebar on the left until you find a template that suits what you’re trying to create.
Step 5: Add information and elements
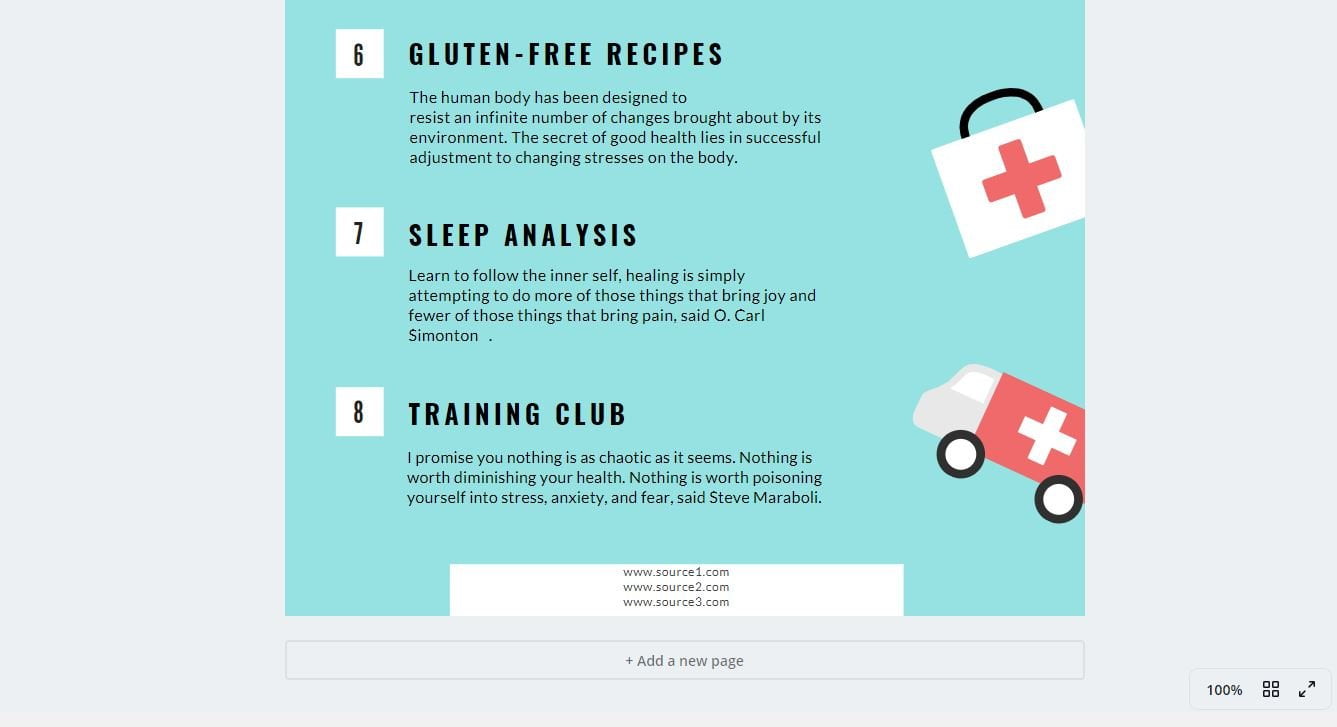
With a template selected, it is now time to begin entering in the information you researched, and customizing the design.
I would recommend beginning by changing the headline.
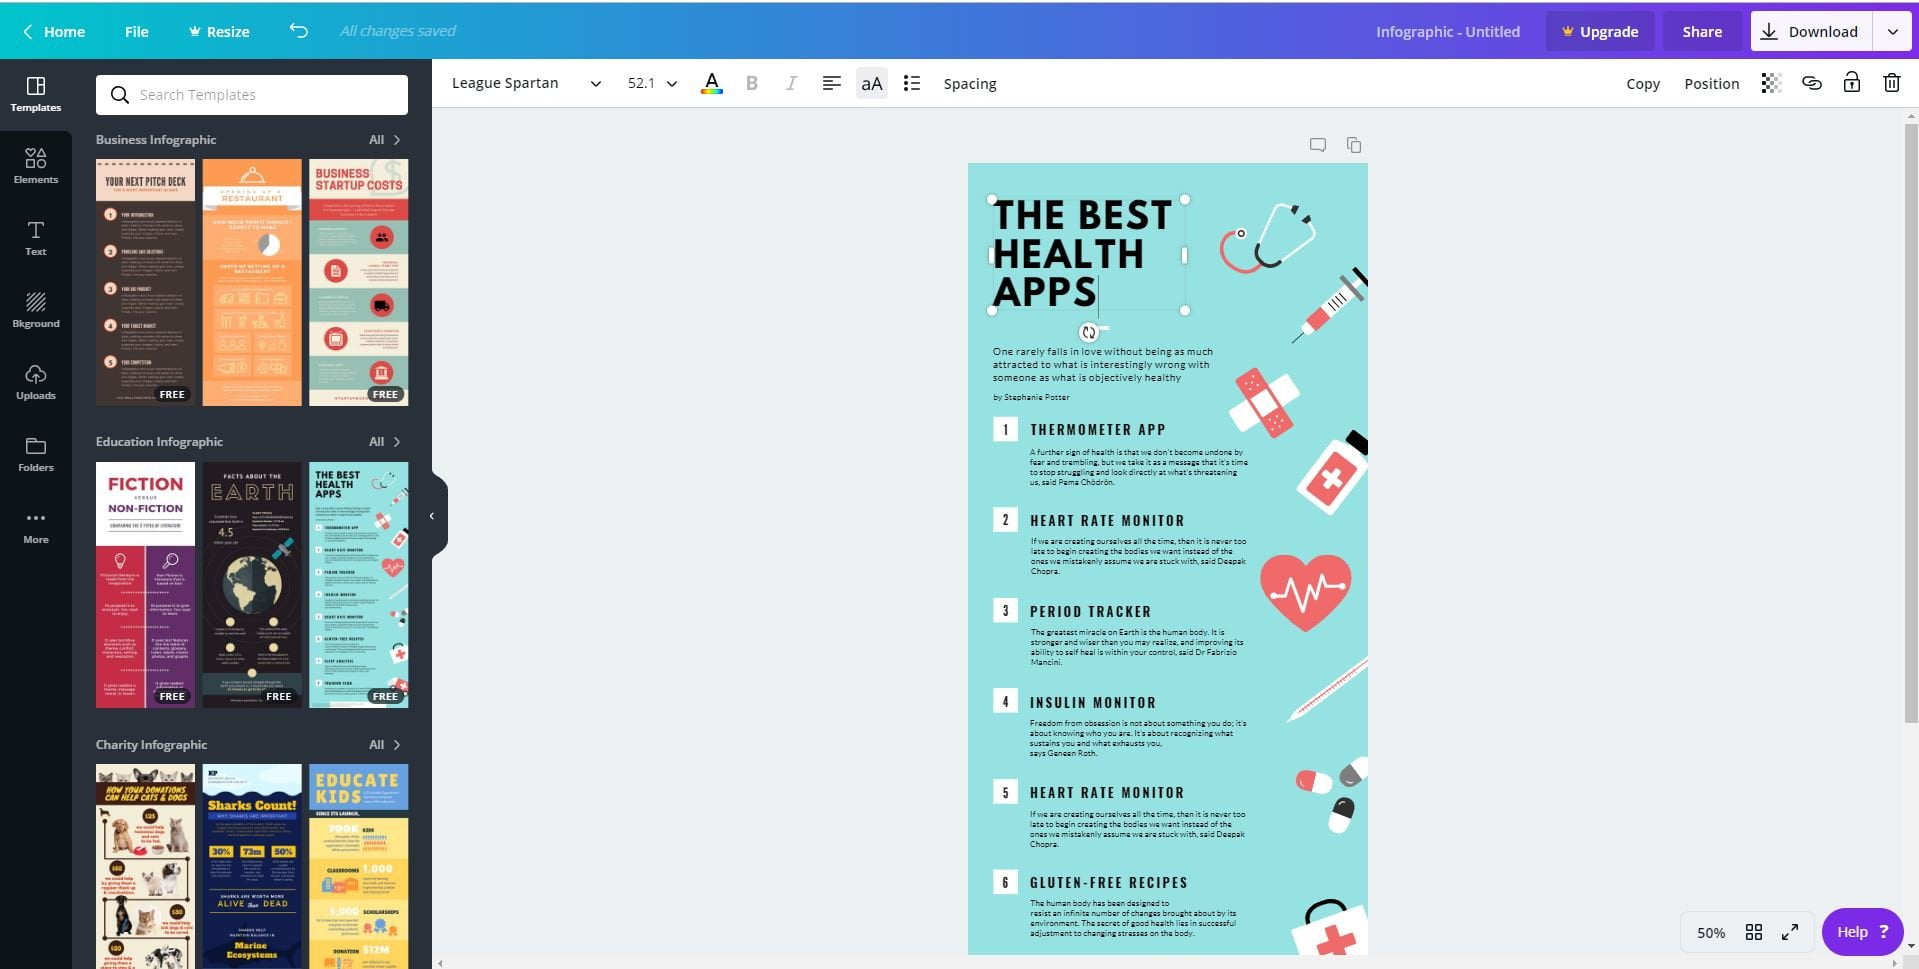
It should summarize what the infographic is about, and can also contain the URL to your website. If it is shared on social media or elsewhere, users will know the original source.
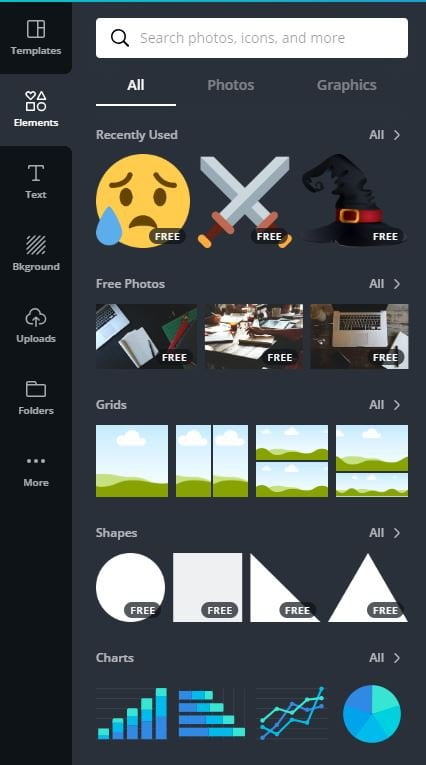
Next, begin adding in elements like shapes, graphs, or illustrations. These should align with the points you make in the infographic, along with providing visual entertainment.
Add them via the “Elements” section on the left sidebar.
The last step is to add resources to the bottom of the infographic. Paste in the links, and feel free to add a “References” or similar header.
Marketing your infographic
Once you have successfully completed an infographic, it’s time to get it out into the world to see!
That means performing outreach campaigns, and I’m going to show you how to execute them effortlessly.
Step 1: Make a hit list of leads
You need to first narrow down the types of websites or companies you wish to pitch the infographic to. If you made a graphic on lead generation, it’d be wise to contact lead gen agencies or blogs.
There are many directories at your disposal to find these prospects, such as AngelList’s company database.
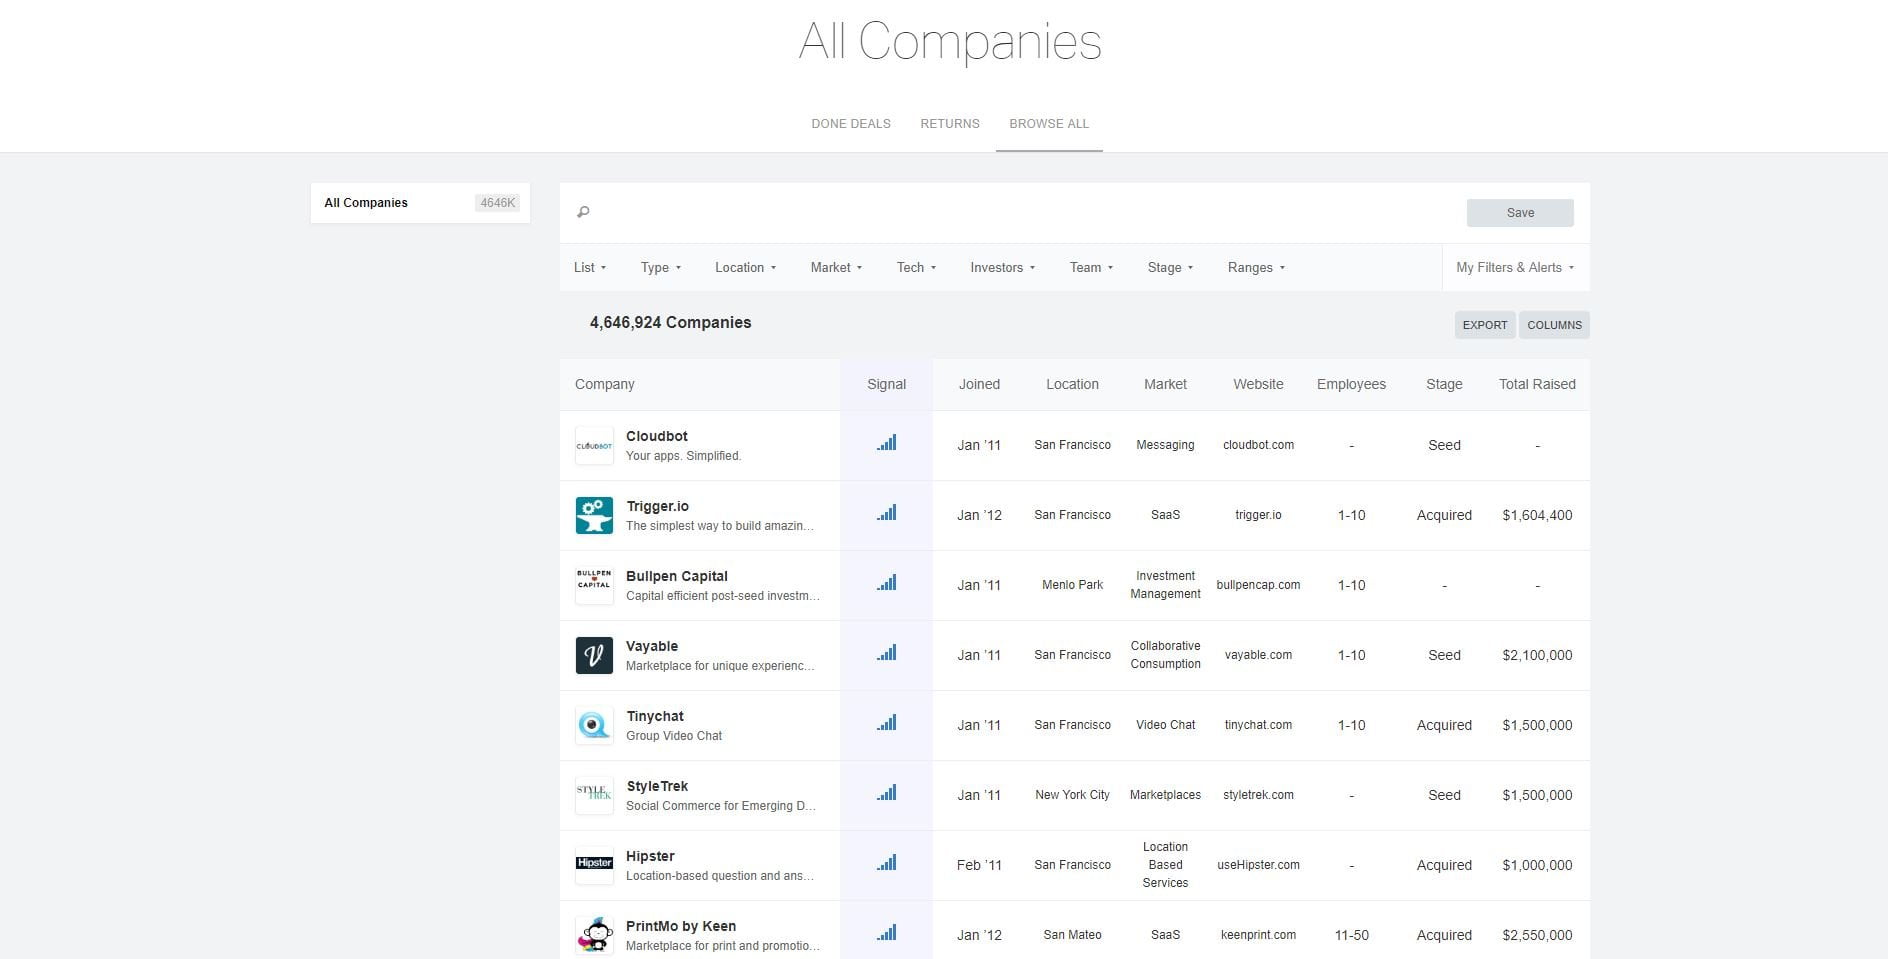
Filter the database how you’d like, and enter in a keyword to further refine the search results.
The main column you need to pay attention towards is the 6th, which is their website. Visit it to ensure that they are a good fit for your infographic, and that will take us to the next step.
Step 2: Start a cold email campaign
With a prospect’s website in hand, it is now time to find an email address to contact them at.
I suggest using the freemium tool Hunter.io to do this. I’ve been using it for many months now, and it’s absolutely priceless for what it offers.
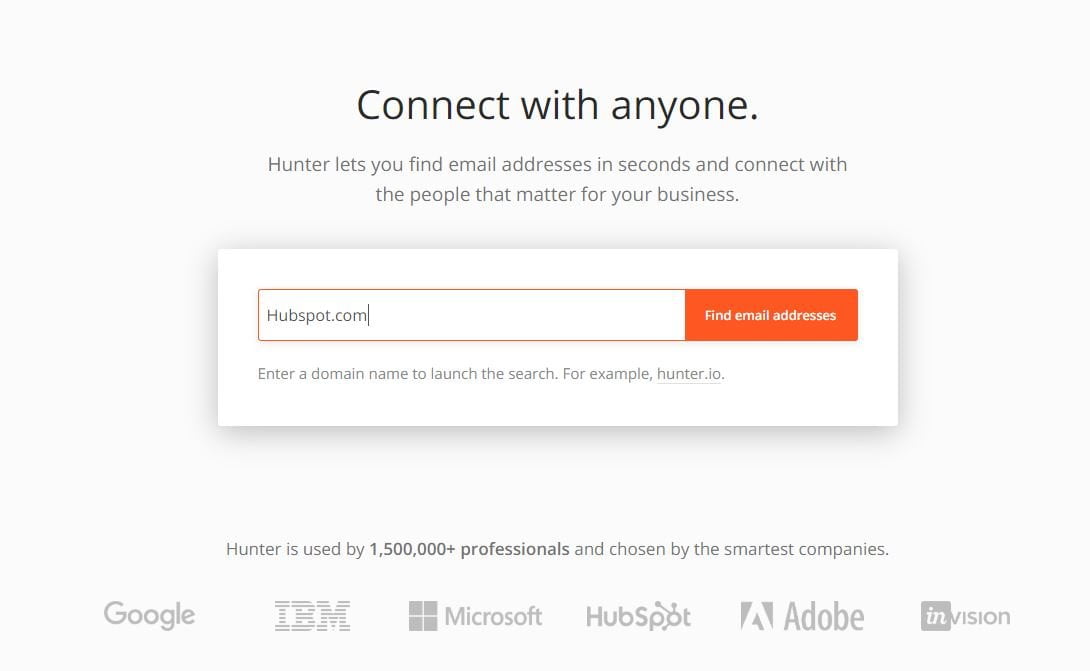
Enter in the URL, and hit the “Find email addresses” button.
This will scrape the internet for all of the associated domain emails it can find. The results can be filtered by position, and the source of the email is also displayed.
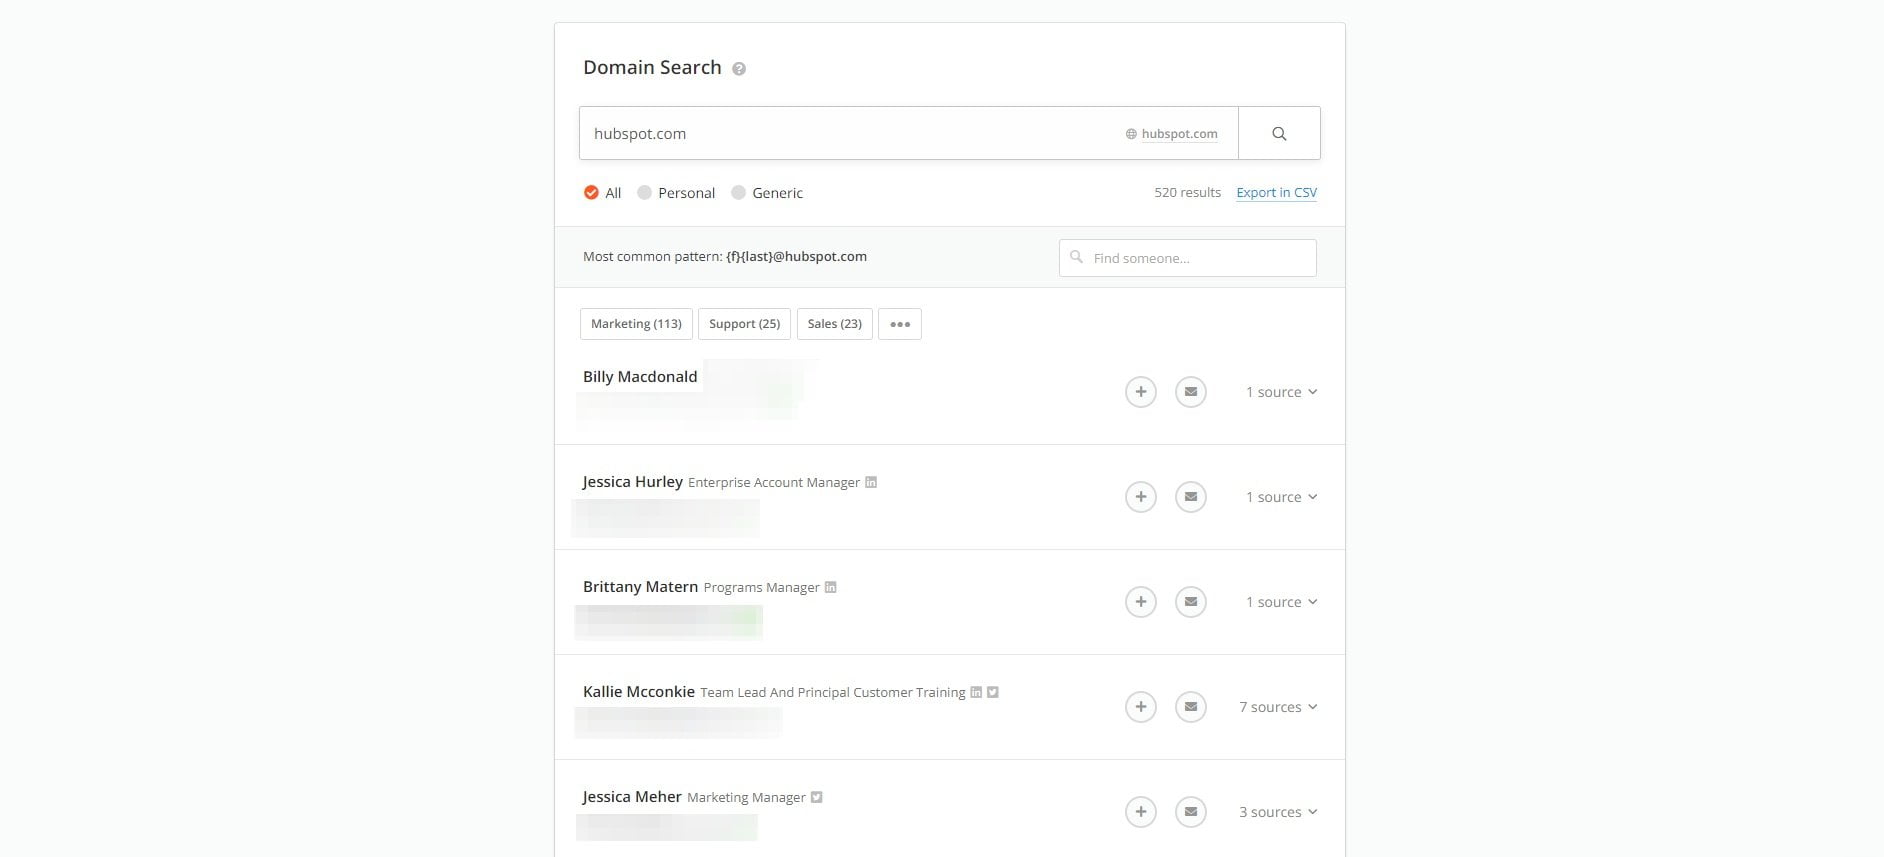
The emails can be exported out as a CSV file, which is what I would recommend to stay organized.
You then will need to use the CRM of your choice to begin emailing these prospects.
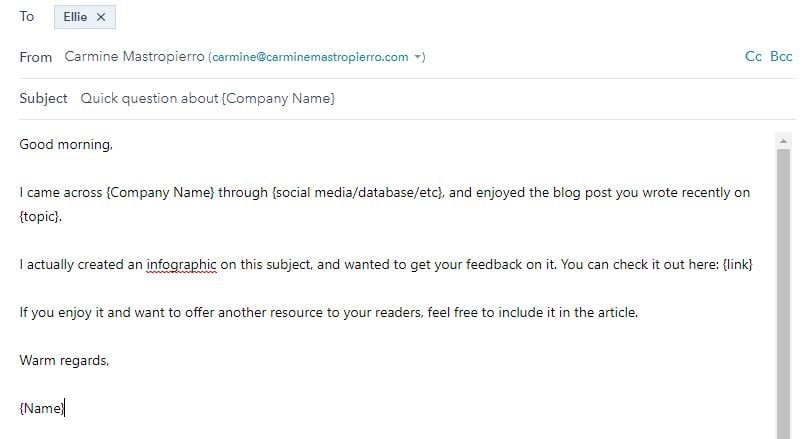
Here’s an infographic outreach template you can try yourself. Feel free to adjust it accordingly, and add a twist to it if you’d like.
Step 3: Follow up!
It’s been found that the optimal amount of email messages for outreach is five.
This means that you can’t send out a single email and hope that a website will link to or share your infographic.
You will need to follow up with them if you wish to catch them at the right time because that’s what it comes down to.
You’re emailing marketing directors, founders, etc, who are busy people. I’m sure they’d love to check out your graphic, but you have to email them when they have time.
That’s why following up is so powerful.
I recommend following up every two to three days, and sending a different follow up email every time.
Personalize it, and ask questions such as:
- Have you found time to check out the infographic I sent you?
- Would there be an ideal time to email or call you to discuss this?
- Do you have any suggestions that would make the infographic better?
The more you follow up like this, the more successful your outreach campaign will be.
Upload it to websites
Besides reaching out to prospects, infographics should also be uploaded to relevant websites. The first of which is Pinterest.
Pinterest is used by over 250 million users every month. Graphics go viral when people beginning pinning it over and over, and yours could, too.
Ensure that you’ve set up a professional looking account first. Include a high resolution display picture, thorough description, and create several boards.
Look at Neil Patel, for example. He has a professional picture, many different boards, link to his site, and catchy description.
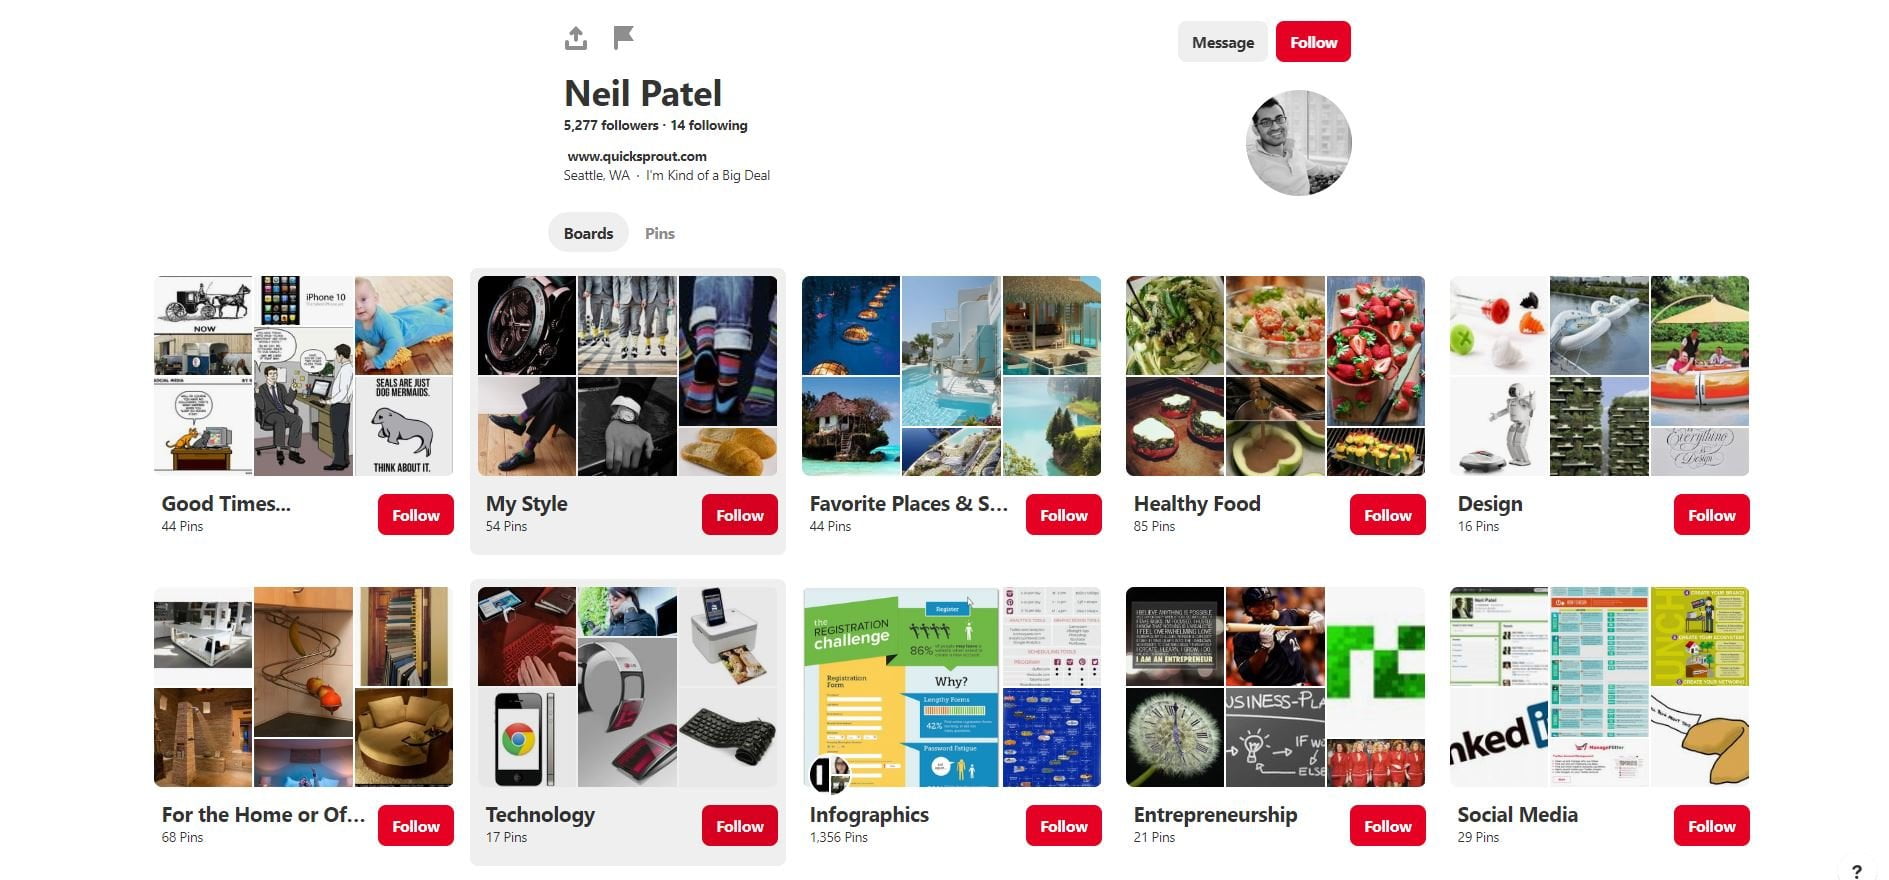
Break down boards based on individual topics, such as SEO, content marketing, and lead generation.
Upload infographics you make about these subjects to their respective boards, and let the nature of social media do its thing.
With a good caption and title, your pins will get shares and traffic gradually with time.
Other websites for uploading infographics include:
Final thoughts
Infographics are amazing resources to offer to readers.
They also serve as linkable assets that can be used at the heart of link building campaigns.
Use a tool like Canva to create an infographic that is fun, practical, and improves the viewer’s knowledge.
Promote it through outreach and social media to begin acquiring backlinks and referral traffic afterwards.
What’s your experience been with infographic marketing?